.NET (Micro)ORM fetch benchmark results and the fine details
For some time now I maintain the RawDataAccessBencher repository on github, and once in a while I run the suite of benchmarks and post the results. In the benchmarks I included all major micro-ORM and full ORM frameworks for .NET which have a significant group of users. The benchmarks are typical ‘micro’ benchmarks in that they run for a relatively short period of time. They also focus solely on fetch performance, how fast the given framework can create a query, fetch the resultset from the database server (on another machine on the network) and materialize objects from the resultset.
In this article I’d like to present the results of the run of today. You can look at the results in a flat list here, or jump straight to the conclusions, by looking at the final results here. So how to read those values? The main point of this benchmark is to illustrate how fast a given framework is compared to its competition for set fetches and individual fetches. The numbers, while interesting, can’t be extrapolated to your own system. So if in the list of results framework X takes 300ms to fetch a set of rows, it doesn’t mean it will take 300ms on your hardware. It will only show it’s faster than framework Y which takes 400ms for the same data. It’s also likely X will be faster than Y on your system or any other system.
I’ve updated RawDataAccessBencher recently with memory allocation values as well, so it’s now also more clear how much memory a framework consumes during a benchmark run. As some of you have asked me about graphs of these results, I’ve put the values in Excel and created some graphs for you to give a more visual overview who’s fast and who’s dropping the ball. I’ve combined the memory consumption graph with the timing graph so you can quickly see if a fast performance comes with a high price (lots of memory) or not.
As data source, the Sales.SalesOrderHeader table is used from AdventureWorks. This is for a reason: it has fields with different types, has a couple of relationships with other entities, relationships of different kinds, has nullable fields and has a reasonable amount of data (31K rows). The benchmarks are divided in two groups: change-tracking fetches and non-change-tracking fetches. This is done mainly to avoid an apple-oranges comparison, as change-tracked fetches can take more performance than read-only, non-change tracked fetches.
If you’re interested, please run the benchmark code on your own system. All dependencies are obtainable from NuGet, you only need the right database data/schema available in a SQL Server database, change the connection string and you’re good to go.
The graphs
With the graphs below, I’ve tried to explained why they are the way they are. All benchmarks were run on .NET 4.7, x64, release builds, clean network. Even though my own work is included in the benchmarks, I’ve tried to keep things fair.
For all graphs: lower is better, the fastest framework / variant is placed at the left. Some frameworks have multiple results in one benchmark, e.g. because they offer multiple APIs or offer ways to pre-compile queries, which affect results. Each graph therefore is more than just the winner and the loser, ok? Good ![]()
Ok, let’s dive in!
Set fetches, non-change tracking
This is a straight-forward fetch: fetch all rows in the table Sales.SalesOrderHeader into objects and don’t do any change tracking.
Here, the hand-written, hand-optimized materializer using a DbDataReader is the fastest. This is no surprise, there’s little room here to get any faster. On the other side of the spectrum we’re seeing Massive, which uses Expando/Dynamic to materialize the rows. I happen to be the maintainer of Massive and of course have profiled the codebase to see where the performance is lost. This came down to the caching mechanism implemented in the Expando implementation inside .NET. The only way to make this much faster was to implement my own Expando class. As these then wouldn’t be interchangeable with vanilla .NET Expando instances, I haven’t made this change.
The vast majority of the results are in a narrow range, from PetaPoco Fast till LLBLGen Pro, poco with Raw SQL: ranging from 161ms till 168ms. I think the main reason for this is that they’re all using the same trick, more or less: compile a piece of code at runtime, which receives a DbDataReader and which returns an instantiated object with the data of the current row. You can construct this code in various ways, from generating IL at runtime till constructing a lambda and compile it using its Compile() method. You then cache this compiled variant and re-use it with every row. There’s one framework which also does this, but is still faster than this group: Linq to DB. Profiling this framework it shows it not only constructed a lambda (compiled) which then materializes the object, but it was able to guess which fields would likely be NULL or not.
As you can see in the handwritten materializer code, not all fields can be NULL. Most frameworks are testing each field if it’s NULL, and if not, obtain the value, otherwise either ignore the column or set it to null. The reason Linq to DB is faster than the rest is that it skips testing for NULL for fields which can’t be NULL. It does this by examining the schema returned by the DbDataReader. This is risky however. It doesn’t always match with reality. When I discovered how they did this, I started implementing this in the LLBLGen Pro pipeline, but I ran into some problems and I remembered again why: this meta-data isn’t always up to date. Especially in SQL Server, with Views, it can be seriously outdated: if a table’s meta-data is updated it won’t update the meta-data for a view (so it will use the outdated table meta-data) which depends on that table. It will only do so when you drop and recreate the view. Other databases can do this as well. It would be interesting to check whether this is the reason why Entity Framework Core doesn’t support views (yet).
Looking at the memory usage, it’s interesting to see that the framework Microsoft pushed for cloud-apps, its own Entity Framework Core, uses more memory than most other frameworks, and isn’t faster either, on the contrary. In that light, I’m pleased with the results of LLBLGen Pro’s raw SQL API: high performance and low memory usage.
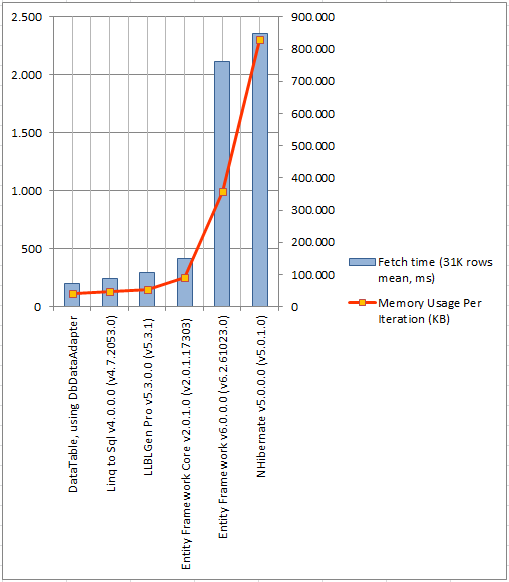
Set fetches, change tracking
This is a straight-forward fetch of entity instances which are change-tracked. This means you can change the value of a field of such an entity object and persist it again to the database using the ORM framework / data-access layer. Tracking changes can have consequences for fetch code, and it’s no surprise the results of change tracked fetches are a bit slower than the non-change tracked results. There’s no free lunch.
It’s quite obvious there are two frameworks which have a serious performance problem here: NHibernate and Entity Framework 6. They’re not only seriously slow, but also consume a massive amount of memory to materialize the entities. Profiling NHibernate v5’s fetch code reveals it’s losing performance all over the place with very long call chains (EF6 has this too btw) in very complex code, and what’s also interesting is that it pays a serious price for its Poco philosophy: the proxy classes it has to create for related elements (EF6 has the same problem) really bog it down. Entity Framework Core doesn’t have this problem, yet, as it doesn’t implement lazy loading, so it can get away with avoiding introducing proxies or at least inject code which will trigger lazy loading of related elements.
Again, I’m happy with the results my own work shows here: LLBLGen Pro’s entity fetch pipeline is very efficient, both in memory consumption and performance. It uses a slightly different philosophy to change tracking: all change tracking is done by an entity itself, so no complex bookkeeping or manual graph handling when you want to save some entities; they know what’s changed already, no need to compare their state with some in-memory state of a shadow entity in some context you need to keep alive.
What’s every time a shining light of how Microsoft mismanaged its own data-access APIs is Linq to SQL. It keeps kicking Entity Framework (core)’s ass, while it’s barely updated nowadays. Oh and don’t forget the DataTable based approach, which is hard to beat, even in 2017. I doubt we’ll ever beat it. I for one don’t know any more tricks to add to my own framework without cutting corners to get passed it and I doubt others will too.
Individual Fetches, non-change tracking
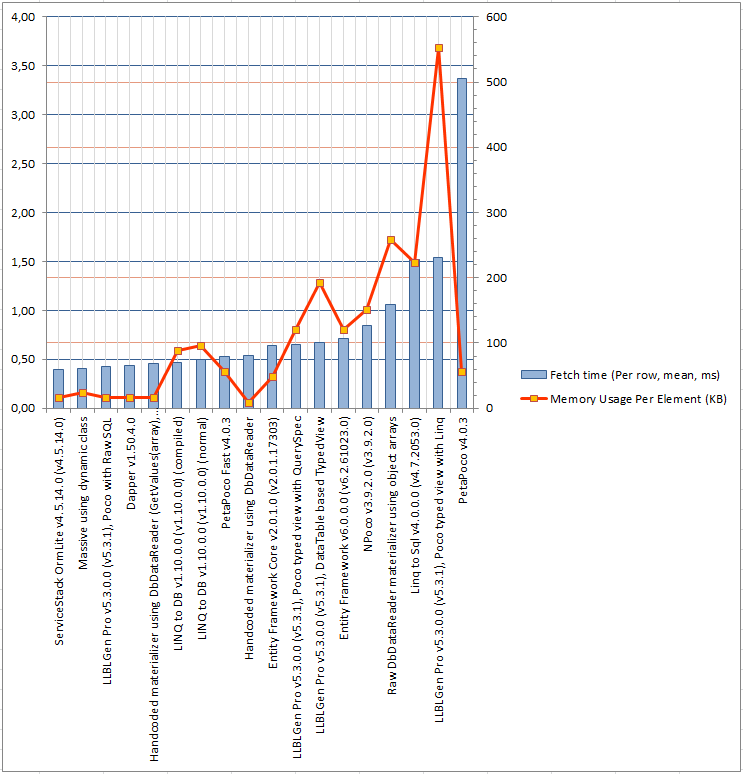
This is a fetch of individual rows, based on a given PK. It will fetch 100 rows based on a previously fetched set of 100 PK values, one row at a time, utilizing the complete fetch pipeline, so not a tight loop. This fetch gives a high emphasis on query construction even though the query is fairly simple, compared to pure object materialization in the set fetches. This benchmark is for non-change tracking fetches, so all frameworks fetch read-only non-change tracked objects.
Here we’re seeing some interesting results. First, the hand-written, hand-optimized materializer is surpassed (with a fraction) by a couple of frameworks, illustrating how close together this group is (with a delta of 0.15ms). Then, the slowest non-change tracking framework in the set benchmark, Massive, is now one of the fastest. The main reason is again Expando. The call chain inside Massive is very short, and as it’s just one row, the part which makes Massive slow in set fetches, the Expando caching system, is never invoked.
Slowest is PetaPoco (though we’re talking 3.37ms), which seems to be caused by the fact it’s not really optimized for this scenario; it seems it doesn’t cache the projection code I mentioned earlier, so for every query it has to rebuild that. Second slowest is LLBLGen Pro using its Linq API. If I compare this with the results of LLBLGen Pro using its QuerySpec API and the results using the LLBLGen Pro raw SQL API (3rd fastest), it’s clear the Linq pipeline is the culprit here: both the Linq API and the QuerySpec API translate to the Low-level API (not in the benchmark) and its objects, which translate to SQL. The materialization pipeline is roughly the same as the raw SQL API materialization with one difference: it has to take into account type conversions. Per query it has to do this work, once, hence the difference with the raw SQL API. The more work one has to do per query, the slower it will appear in this benchmark.
The Linq variant also consumes more memory than the QuerySpec variant, mainly because the framework doesn’t use any expression tree caching. This means it has to transform the whole expression tree to SQL every time, which can be costly memory wise, as every expression transformation requires a rebuild of the tree using newly created objects (as expression tree elements are immutable). It’s a choice whether to cache the expressions coming in or evaluate it every time. Caching the trees can be efficient in scenarios where a small set of queries is used in a high frequency. If queries differ a lot, caching the trees isn’t really beneficial. It’s however difficult to decide when the tipping point occurs. For now I’ve chosen not to implement this kind of tree caching, as LLBLGen Pro offers 4 different query systems, it’s often easier to optimize individual queries using one of the other query systems than to implement a caching system which is beneficial in only a a subset of the cases and which hurts in a lot of other cases.
Individual fetches, change tracking
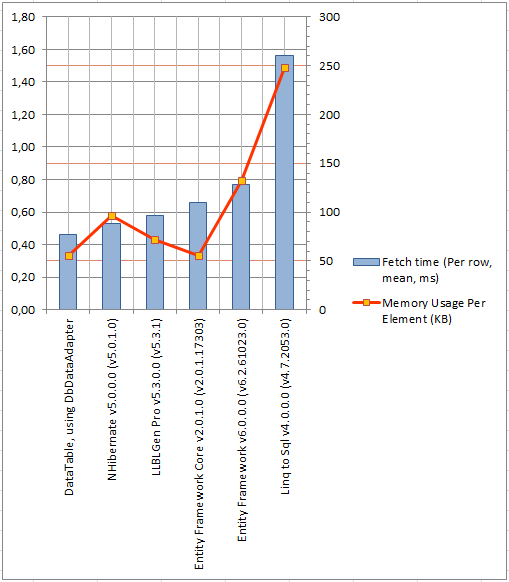
This is a fetch of individual rows, based on a given PK, it’s the same as with the non-change tracking individual fetches, except this time, change tracked entities are fetched, one at a time.
The same thing we saw with the non-change tracked individual benchmarks is also present here: the slowest of the set fetches is now one of the fastest. Here too we see a Linq based framework struggling for memory consumption, this time it’s Linq to SQL. Although Entity Framework Core uses a Linq query (a Single() call) as well, I suspect they’re using query caching along the way, as rewriting the query from a Single(lambda) to a full from select with a FirstOrDefault call gave the same results; the latter tree much deeper than the former, which suggests a caching of expression tree –> SQL conversions.
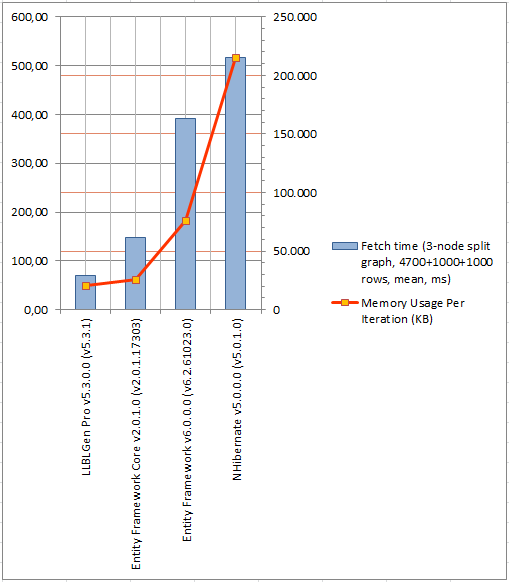
Eager loading, 3-node split graph
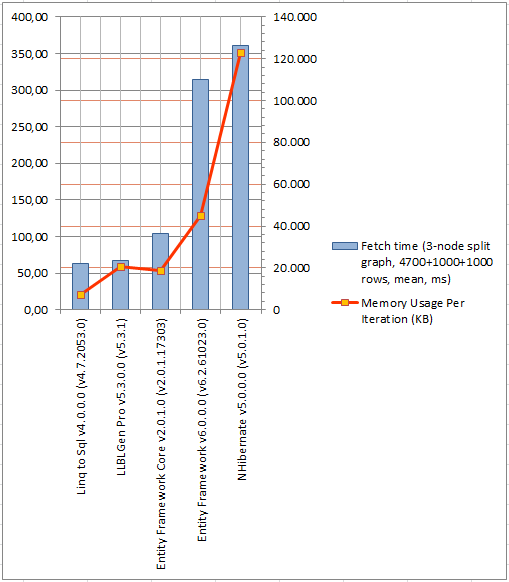
This benchmark fetches a split, 3-node graph of change-tracked entity instances using eager loading: one ORM query fetches the complete graph. It fetches 1000 SalesOrderHeader entities and their related SalesOrderDetail entities and Customer entities.
It’s likely not a surprise that the performance of set fetches in an eager loading scenario is the same as with the set fetches earlier: NHibernate and Entity Framework 6 are embarrassingly slow and especially in the case of NHibernate consume a lot of memory. What’s interesting is that there are different scenarios used by the frameworks: as it’s a split graph, it might be better to choose for one query per graph node, instead of joining everything together (to avoid duplicate rows). Linq to SQL still comes up top, even though it does use the Join approach. LLBLGen Pro uses a one query per node approach, same for Entity Framework Core. The number of root entities is set to 1000 which is outside the window where the LLBLGen Pro query optimizer will optimize the eager loading queries by switching from sub queries to parameters.
Eager loading, 3-node split graph, async
This benchmark is equal to the previous one, however this time an async query is used. The benchmark doesn’t use async queries except in this benchmark as it makes more sense to test it in this scenario with multiple database queries issued by the ORM.
The usual suspects are on the right side of the graph, but what’s interesting is Entity Framework Core compared to LLBLGen Pro. Not only is Entity Framework Core’s performance significantly slower than in the synchronous variant memory usage is also up, where LLBLGen Pro’s sync performance is very close to the async performance and memory usage is roughly the same. This puzzled me a bit the first time I saw it. At first I was afraid I made a serious mistake somewhere and the async code in LLBLGen Pro accidentally ran as synchronous but profiling the code again clearly revealed what was expected: it was async from start to finish.
What could explain the difference? I have to guess, but I think it might be call chain length combined with the nasty aspect of async code: fragmentation of code bases. With async code, it ripples through your code like wildfire: every method that’s async has to be called by an async method. If that code is also shared with the synchronous API, you can do two things: wrap it so the async code runs synchronous in the synchronous variant (which likely will cause a performance hit) or factor out the code which is shared.
This factoring out might cause performance problems for async or for sync paths. A long call chain causes lots of statemachines being created and this too could lead to less optimal performance. All in all, it’s not an easy fix.
Conclusion
What conclusion can one draw from the information provided? If I may, I’d like to advice you to look at all the graphs. Your application is likely not only doing read-only fetches, but will also fetch single entities, large sets, will modify sets in memory, will fetch graphs. It’s good to see how a given framework performs over all the graphs provided. Also keep in mind this is just a snapshot of what an ORM has to offer.
For modern apps, which more and more move to the cloud, memory consumption as well as high-performance are key to keep costs low. It’s therefore important to look for a complete framework which offers low memory consumption, high performance and allows you to fetch the data the way you want: with high-level queries when you want to, and low-level SQL when you need to.
