Windows Azure: New Distributed, Dedicated, High Performance Cache Service + More Cool Improvements
This morning we released some great updates to Windows Azure. These new capabilities include:
- Dedicated Cache Service: Announcing the preview of our new distributed, dedicated, high performance cache service
- AutoScale: Schedule-based auto-scaling for Web Sites and Virtual Machines and richer AutoScale history logs
- Web Sites: New Web Server Logging Support to save HTTP Logs to Storage Accounts
- Operation Logs: New Filtering options on top of Operation Logs
All of these improvements are now available to use immediately (note: some are still in preview). Below are more details about them.
Windows Azure Cache Service: Preview of our new Distributed Cache Service
I’m excited today to announce the preview release of the new Windows Azure Cache Service – our latest service addition to Windows Azure. The new Windows Azure Cache Service enables you to easily deploy dedicated, high performance, distributed caches that you can use from your Windows Azure applications to store data in-memory and dramatically improve their scalability and performance.
The new Windows Azure Cache Service can be used by any type of Windows Azure application – including those hosted within Windows or Linux Virtual Machines, as well as those deployed as a Windows Azure Web Site and Windows Azure Cloud Services. Support for Windows Azure Mobile Services will also be enabled in the future.
You can instantiate a dedicated instance of a Windows Azure Cache Service for each of your apps, or alternatively share a single Cache Service across multiple apps. This later scenario is particularly useful when you wish to partition your cloud backend solutions into multiple deployment units – now they can all easily share and work with the same cached data.
Benefits of the Windows Azure Cache Service
Some of the benefits of the new Windows Azure Cache Service include:
- Ability to use the Cache Service from any app type (VM, Web Site, Mobile Service, Cloud Service)
- Each Cache Service instance is deployed within dedicated VMs that are separated/isolated from other customers – which means you get fast, predictable performance.
- There are no quotas or throttling behaviors with the Cache Service – you can access your dedicated Cache Service instances as much or as hard as you want.
- Each Cache Service instance you create can store (as of today’s preview) up to 150GB of in-memory data objects or content. You can dynamically increase or shrink the memory used by a Cache Service instance without having to redeploy your apps.
- Web Sites, VMs and Cloud Service can retrieve objects from the Cache Service on average in about 1ms end-to-end (including the network round-trip to the cache service and back). Items can be inserted into the cache in about ~1.2ms end-to-end (meaning the Web Site/VM/Cloud Service can persist the object in the remote Cache Service and gets the ACK back in 1.2ms end-to-end).
- Each Cache Service instance is run as a highly available service that is distributed across multiple servers. This means that your Cache Service will remain up and available even if a server on which it is running crashes or if one of the VM instances needs to be upgraded for patching.
- The VMs that the cache service instances run within are managed as a service by Windows Azure – which means we handle patching and service lifetime of the instances. This allows you to focus on building great apps without having to worry about managing infrastructure details.
- The new Cache Service supports the same .NET Cache API that we use today with the in-role cache option that we support with Cloud Services. So code you’ve already written against that is compatible with the new managed Cache Service.
- The new Cache Service comes with built-in provider support for ASP.NET Session State and ASP.NET Output Page Caching. This enables you to easily scale-out your ASP.NET applications across multiple web servers and still share session state and/or cached page output regardless of which customer hit which server.
- The new Cache Service supports the ability to either use a separate Cache Service instance for each of your apps, or instead share a single Cache Service instance across multiple apps at once (which enables easy data sharing as well as app partitioning). This can be very useful for scenarios where you want to partition your app up across several deployment units.
Creating a Cache Service
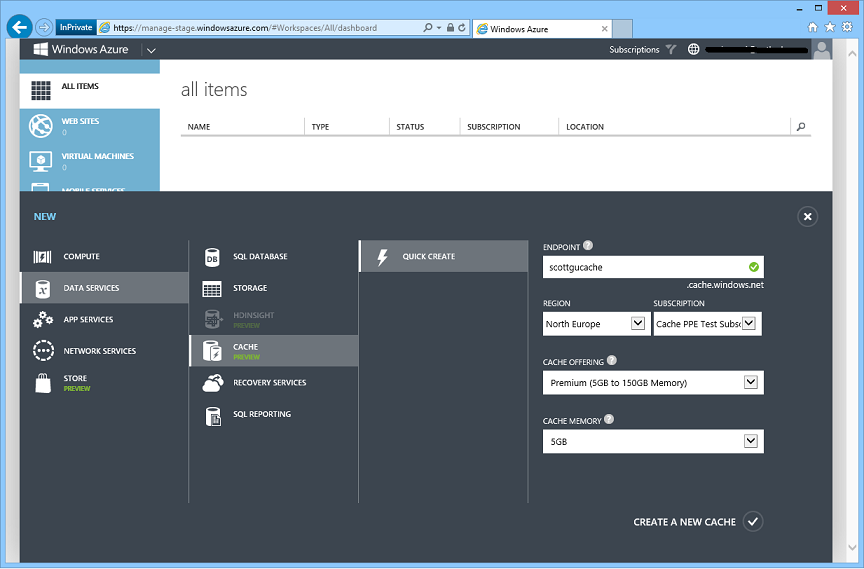
You can easily create a new Cache Service by going to the Windows Azure Management Portal and using the NEW -> DATA SERVICES -> CACHE option:
In the screenshot above, we specified that we wanted to create a new Premium cache of 5 GB named “scottgucache” in the “North Europe” region. Once we click the “Create a New Cache” button it will take about a few minutes to provision:
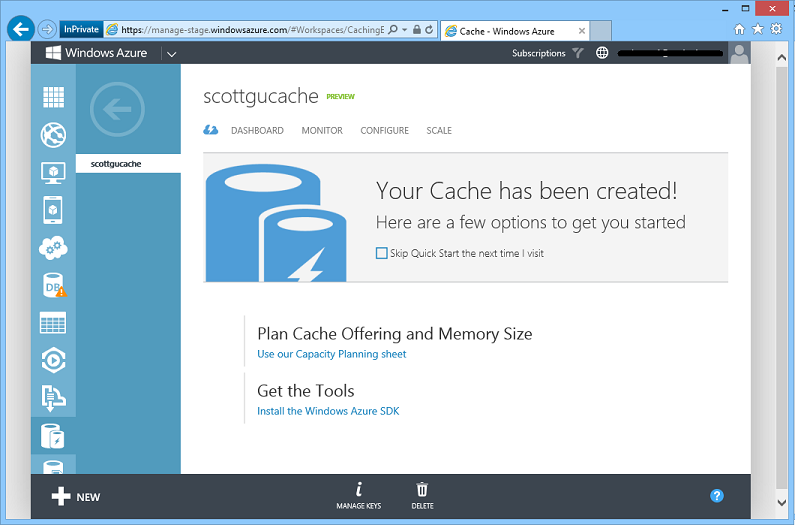
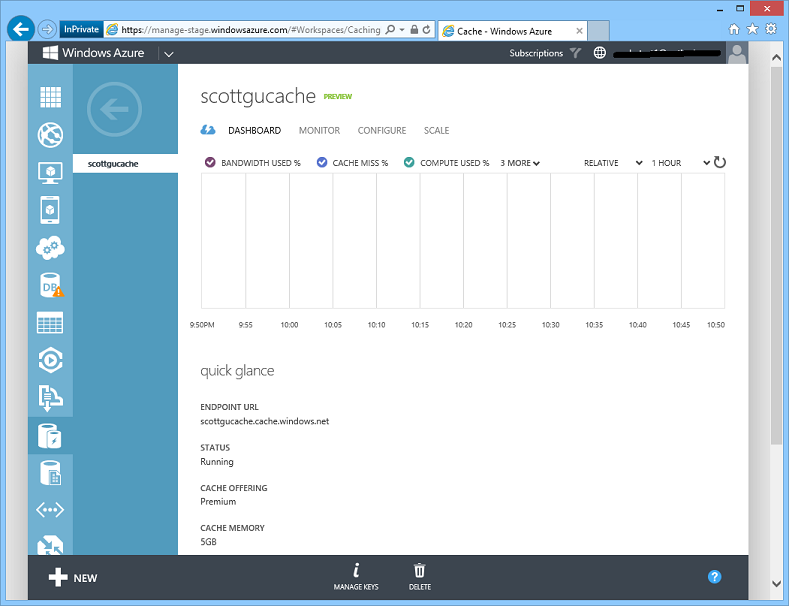
Once provisioned, the cache will show up in the Windows Azure Management Portal just like all of the other Windows Azure services (Web Sites, VMs, Databases, Storage Accounts, etc) within our subscription. We can click the DASHBOARD tab to see more details about it:
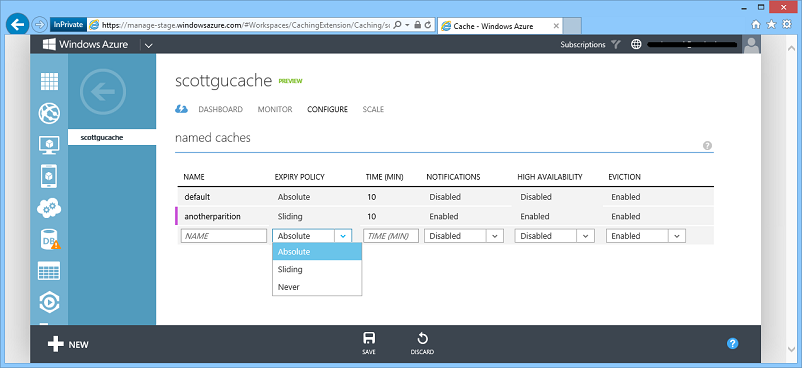
We can use the cache as-is (it comes with smart defaults and doesn’t require changes to get started). Or we can also optionally click the CONFIGURE tab to manage custom settings - like creating named cache partitions and configuring expiration behavior, evicition policy, availability settings (which means a cached item will be saved across multiple VM instances within the cache service so that they will survive even if a server crashes), and notification settings (which means our cache can call back our app when an item it updated or expired):
Once you make a change to one of these settings just click the “Save” button and it will be applied immediately (no need to redeploy).
Using the Cache
Now that we have created a Cache Service, let’s use it from within an application.
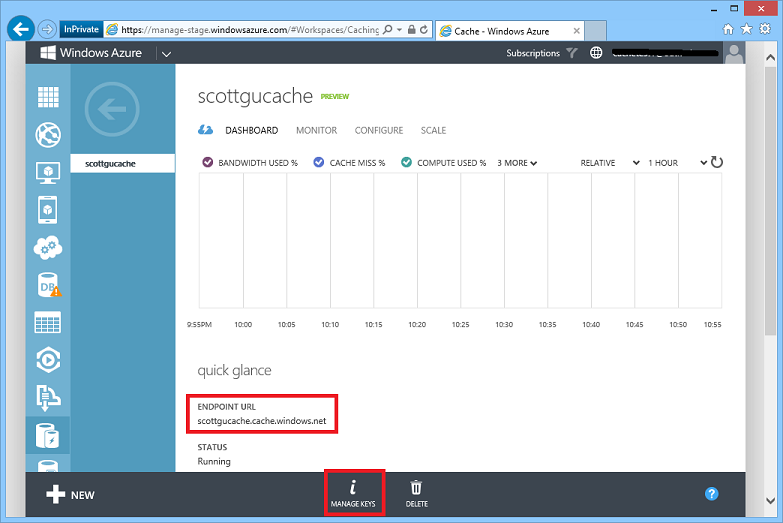
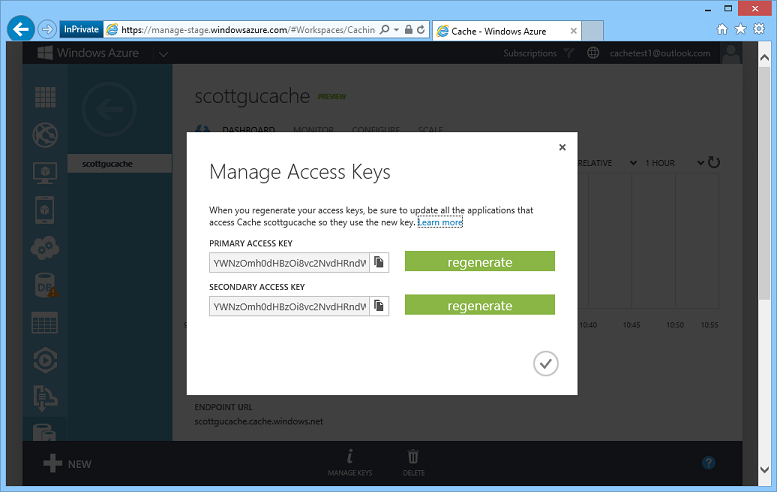
To access the Cache Service from within an app, we’ll need to retrieve the endpoint URL for the Cache Service and retrieve an access key that allows us to securely access it. We can do both of these by navigating to the DASHBOARD view of our Cache Service within the Windows Azure Management Portal:
The endpoint URL can be found in the “quick glance” view of the service, and we can retrieve the API key for the service by clicking the “Manage Keys” button:
Once we have saved the endpoint URL and access key from the portal, we’ll update our applications to use them.
Using the Cache Service Programmatically from within a .NET application
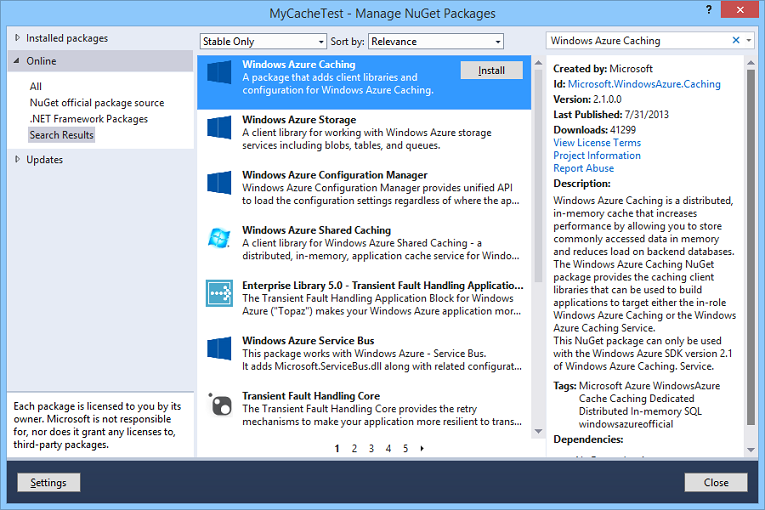
Using the Cache Service within a .NET or ASP.NET applications is easy. Simply right-click on your project within Visual Studio, choose the “Manage NuGet Packages” context menu, search the NuGet online gallery for the “Windows Azure Caching” NuGet package, and then add it to your application:
After you have installed the NuGet Windows Azure Caching package, open up your web.config/app.config file and replace the cache Service EndPoint URL and access key in the dataCacheClient section of your application’s config file:
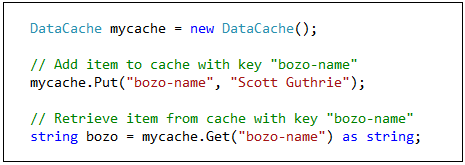
Once you do this, you can now programmatically put and get things from the Cache Service using a .NET Cache API with code like below:
The objects we programmatically add to the cache will be automatically persisted within the Cache Service and can then be shared across any number of VMs, Web Sites, Mobile Services and Cloud Services that are using the same Cache Service instance. Because the cache is so fast (retrievals take on average about 1ms end-to-end across the wire and back) and because it can save 100s of GBs of content in-memory, you’ll find that it can dramatically improve the scalability, performance and availability of your solutions. Visit our documentation center to learn more about the Windows Azure Caching APIs.
Enabling ASP.NET Session State across a Web Farm using the Cache Service
The new Windows Azure Cache Service also comes with a supported ASP.NET Session State Provider that enables you to easily use the Cache Service to store ASP.NET Session State. This enables you to deploy your ASP.NET applications across any number of servers and have a customer’s session state be available on any of them regardless of which web server the customer happened to hit last in the web farm.
Enabling the ASP.NET Session State Cache Provider is really easy. Simply add the below configuration to your web.config file:
Once enabled your customers can hit any web server within your application’s web farm and the session state will be available. Visit our documentation center to learn more about the ASP.NET session state provider as well as the Output caching provider that we also support for ASP.NET.
Monitoring and Scaling the Cache
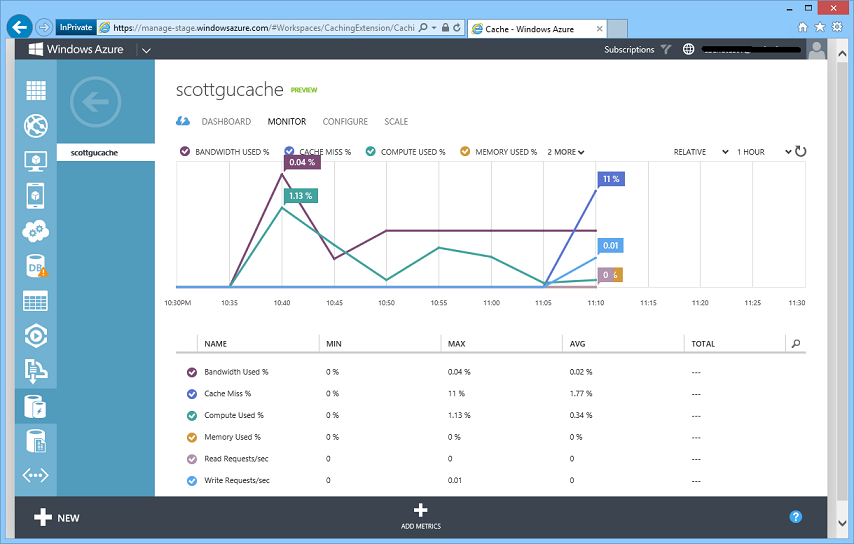
Once your Cache Service is deployed, you can track the activity and usage of the cache by going to its MONITOR tab in the Windows Azure Management Portal. You can get useful information like bandwidth used, cache miss percentage, memory used, read requests/sec, write requests/sec etc. so that you can make scaling decisions based on your real-world traffic patterns:
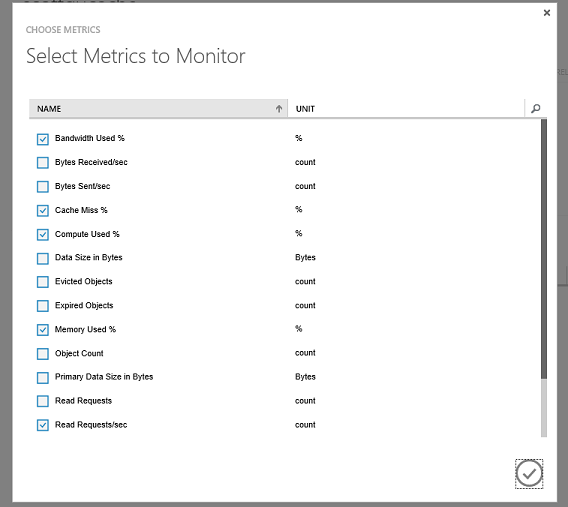
You can also customize the monitoring page to see other metrics of interest instead of or in addition to the default ones. Clicking the “Add Metrics” button above provides an easy UI to configure this:
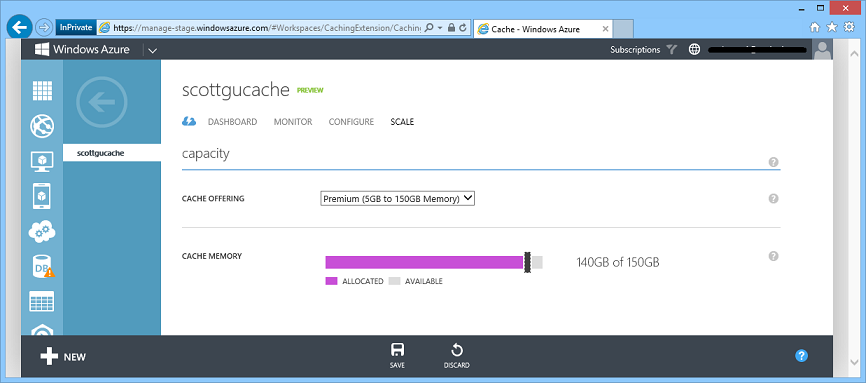
If you need to scale your cache due to increased traffic to your application, you can go to the SCALE tab and easily change the cache offering or cache size depending on your requirements. For this example we had initially created a 5GB Premium Cache. If we wanted to scale it up we could simply expand the slider below to be 140GB and then click the “Save” button. This will dynamically scale our cache without it losing any of the existing data already persisted within it:
This makes it really easy to scale out your cache if your application load increases, or reduce your cache size if you find your application doesn’t need as much memory and you want to save costs.
Learning More
The new Windows Azure Cache Service enables you to really super-charge your Windows Azure applications. It provides a dedicated Cache that you can use from all of your Windows Azure applications – regardless of whether they are implemented within Virtual Machines or as Windows Azure Web Sites, Mobile Services, or Cloud Services. You’ll find that it can help really speed up your applications, improve your app scalability, and make your apps even more robust.
Review our Cache Service Documentation to learn more about the service. Visit here to learn more about more the details about the various cache offering sizes and pricing. And then use the Windows Azure Management Portal to try out the Windows Azure Cache Service today.
AutoScale: Schedule Updates for Web Sites + VMs, Weekend Schedules, AutoScale History
Three weeks ago we released scheduled AutoScale support for Cloud Services. Today, we are adding scheduled AutoScale support to Web sites and Virtual Machines as well, and we are also introducing support for setting up different time schedule rules depending on whether it is a weekday or weekend.
Time Scheduled AutoScale Support for Web Sites and Virtual Machines
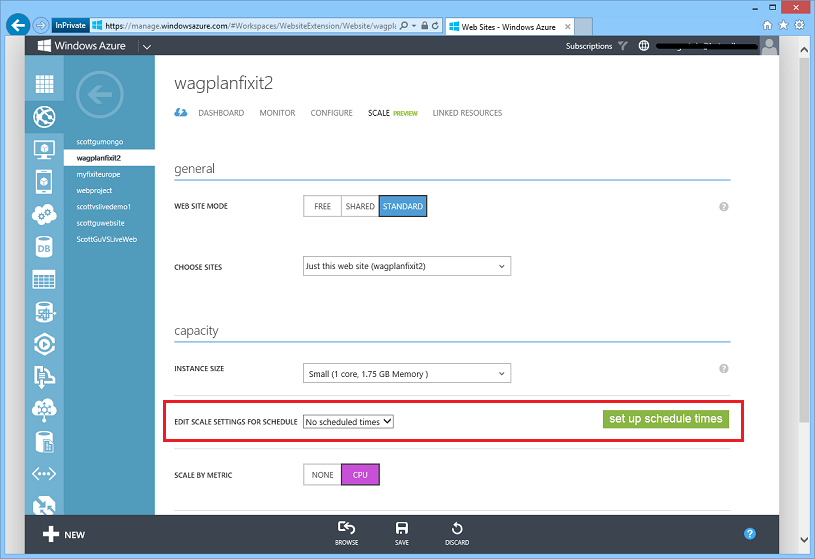
Just like for Cloud Services, you can now go to the Scale tab for a Virtual Machines or a Web site, and you’ll see a new button to Set up schedule times:
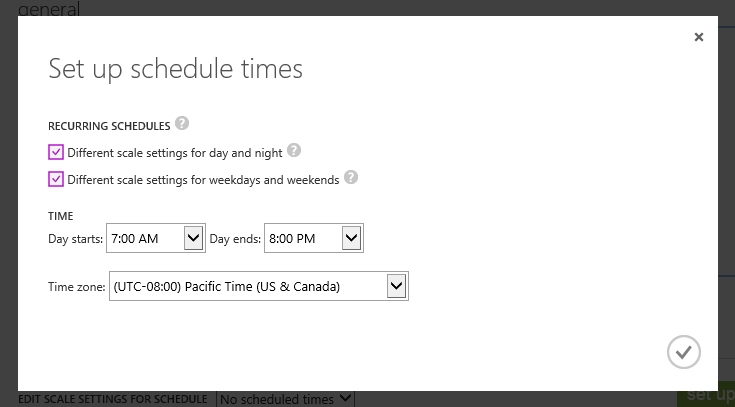
Scheduled AutoScale works the same way now for Web Sites and Virtual Machines as for Cloud Services. You can still choose to scale the same way at all times (by selecting No scheduled times), but you can now click the “Set up schedule times” dialog to setup scale rules that run differently depending on the time of day:
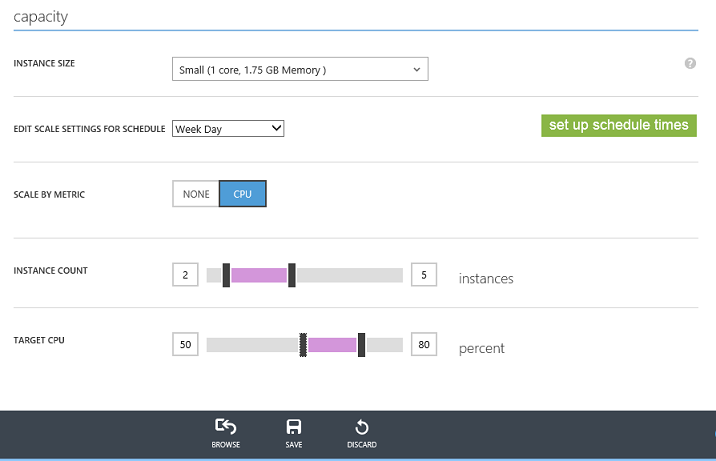
Once you define the start and stop of the day using the dialog above, you can then go back to the main scale tab and setup different rules for each time segment. For example, below I’ve setup rules so that during Week Days we’ll have between 2 and 5 small VMs running for our Web Site. I want AutoScale to scale-up/down the exact number depending on the CPU percentage of the VMs:
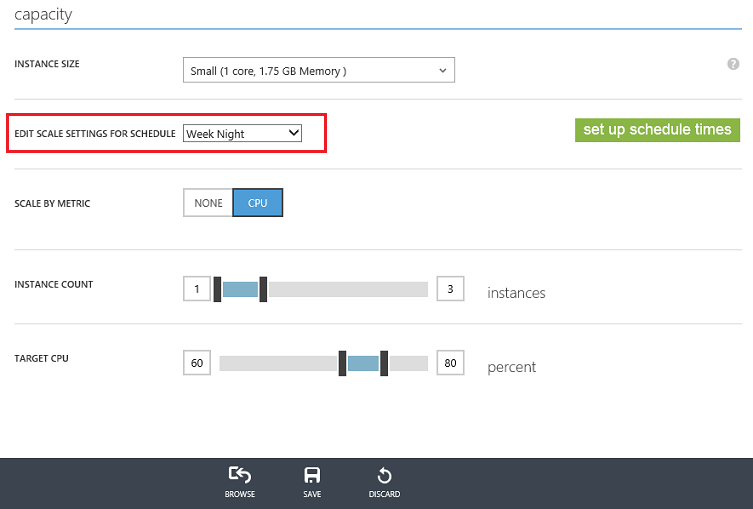
On Week Nights, though, I don’t want to have as many VMs running, so I’ll configure it to AutoScale only between 1 and 3 VMs. All I need to do to do this is to change the drop down from “Week Day” to “Week Night” and then edit a different set of rules and hit Save:
This makes it really easy to setup different policies and rules to use depending on the time of day – which can both improve your performance during peak times and save you more money during off-peak times.
AutoScale History
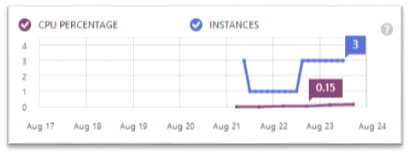
Previously, we supported an instance count graph on the scale tab so you can see the history of actions for your service. With today’s release we’ve improved this graph to now show the sum of CPU usage across all of your instances:
This means that if you have one instance, the sum of the CPU can go from 0 to 1, but if you have three instances, it can go from 0 to 3. You can use this to get a sense of the total load across your entire role, and to see how well AutosSale is performing.
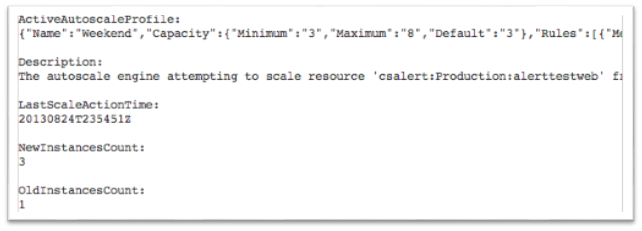
Finally, we’ve also improved the Operation Log entry for AutoscaleAction: it now shows you the exact Schedule that was used to scale your service, including the settings that were in effect during that specific scale action (it’s in the section called ActiveAutoscaleProfile):
Web Sites: Web Server Logging to Storage Accounts
With today’s release you can now configure Windows Azure Web Sites to write HTTP logs directly to a Windows Azure Storage Account. This makes it really easy to persist your HTTP logs as text blobs that you can store indefinitely (since storage accounts can maintain huge amounts of data) and which you can also use to later perform rich data mining/analysis on them.
Storing HTTP Log Files as Blobs in Windows Azure Storage
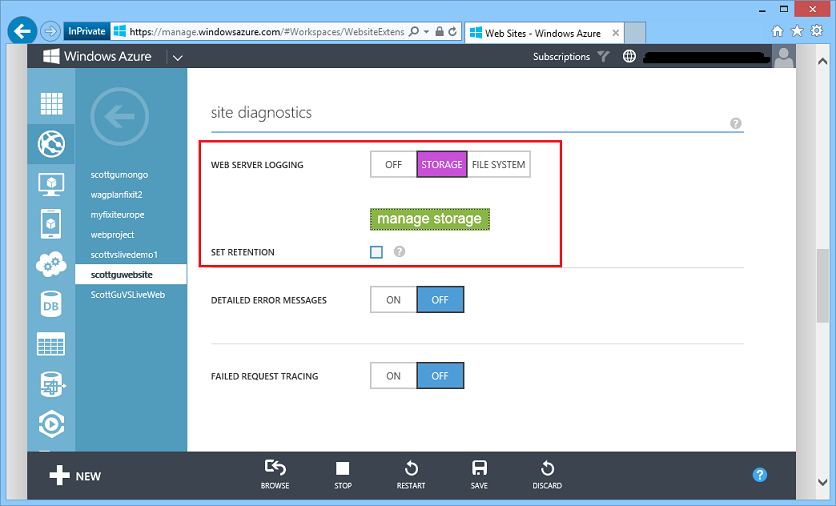
To enable HTTP logs to be written directly to blob storage, navigate to a Web Site using the Windows Azure Management Portal and click the CONFIGURE tab. Then navigate to the SITE DIAGNOSTICS section. Starting today, when you turn “Web Server Logging” ON, you can choose to store your logs either on the file system or in a storage account (support for storage accounts is new as of today):
Logging to a Storage Account
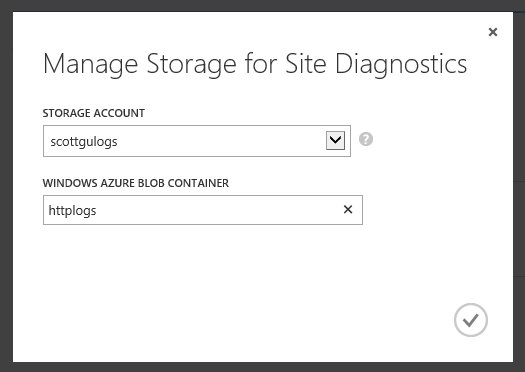
When you choose to keep your web server logs in a storage account, you can specify both the storage account and the blob container that you would like to use by clicking on the green manage storage button. This brings up a dialog that you can use to configure both:
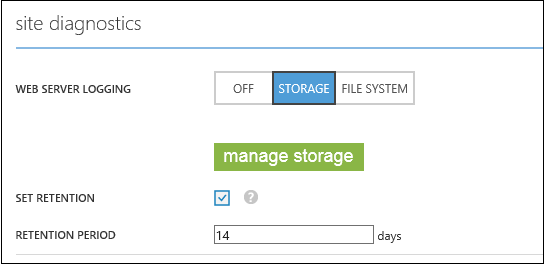
By default, logs stored within a storage account are never deleted. You can override this by selecting the Set Retention checkbox in the site diagnostics section of the configure tab. You can use this to instead specify the number of days to keep the logs, after which they will be automatically deleted:
Once you’ve finished configuring how you want the logs to be persisted, and hit save within the portal to commit the settings, Windows Azure Web Sites will begin to automatically upload HTTP log data to the blob container in the storage account you’ve specified. The logs are continuously uploaded to the blob account – so you’ll quickly see the log files appear and then grow as traffic hits the web site.
Analysis of the Logs
The HTTP log files are persisted in a blob container using a naming scheme that makes it easy to identify which log file correlates to which activity. The log format name scheme is:
[sitename]/[year]/[month]/[day]/[hour]/[VMinstancename].log
The HTTP logs themselves are plain text files that store many different settings in a standard HTTP log file format:
You can easily download the log files using a variety of tools (Visual Studio Server Explorer, 3rd Party Storage Tools, etc) as well as programmatically write scripts or apps to download and save them on a machine. Because the content of the files are in a standard HTTP log format you can then use a variety of tools (both free and commercial) to parse and analyze their content.
For more advanced scenarios, you can also now spin up your own Hadoop cluster using the Windows Azure HDInsight service. HDInsight enables you to easily spin up, as well as quickly tear down, Hadoop clusters on Windows Azure that you can use to perform MapReduce and analytics jobs with. Because HDInsight natively supports Windows Azure Blob Storage, you can now use HDInsight to perform custom MapReduce jobs on top of your Web Site Log Files stored there. This provides an even richer way to understand and analyze your site traffic and obtain rich insights from it.
Operation Logs: Richer Filtering
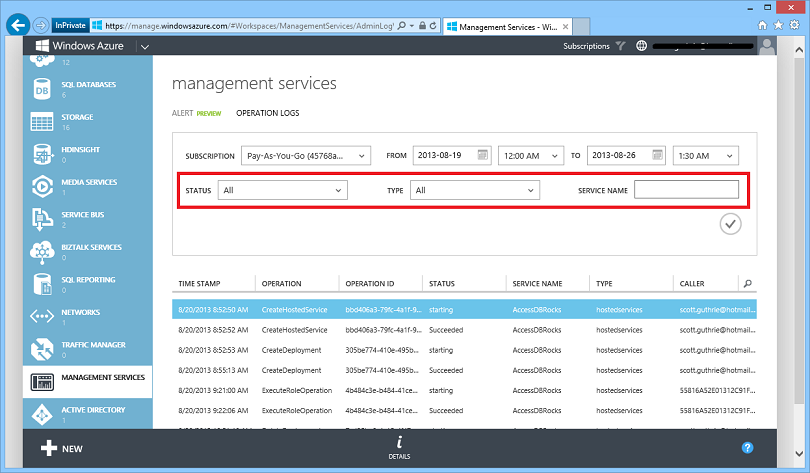
Today’s release adds some improvements to the Windows Azure OPERATION LOGS feature (which you can now access in the Windows Azure Portal within the MANAGEMENT SERVICES section of the portal). We now support filtering based on several additional fields: STATUS, TYPE and SERVICE NAME. This is in addition to the two filters we already support – filter by SUBSCRIPTION and TIME.
This makes it even easier to filter to the specific log item you are looking for quickly.
Summary
Today’s release includes a bunch of great features that enable you to build even better cloud solutions. If you don’t already have a Windows Azure account, you can sign-up for a free trial and start using all of the above features today. Then visit the Windows Azure Developer Center to learn more about how to build apps with it.
Hope this helps,
Scott
P.S. In addition to blogging, I am also now using Twitter for quick updates and to share links. Follow me at: twitter.com/scottgu
