VS 2008 JavaScript Debugging
A few weeks ago I blogged about the new JavaScript Intellisense support in VS 2008.
One of the other JavaScript features that I'm sure will be popular in VS 2008 is the much-improved support for JavaScript debugging. This is enabled in both the free Visual Web Developer 2008 Express edition as well as in Visual Studio, and makes using JavaScript and building AJAX applications significantly easier.
Setting JavaScript breakpoints in ASP.NET pages
One of the annoying things with VS 2005 is that you have to first run your ASP.NET pages before you can set JavaScript breakpoints in them in the debugger.
VS 2008 makes this much better by adding new support that allows you to set client-side JavaScript breakpoints directly within your server-side .aspx and .master source files:
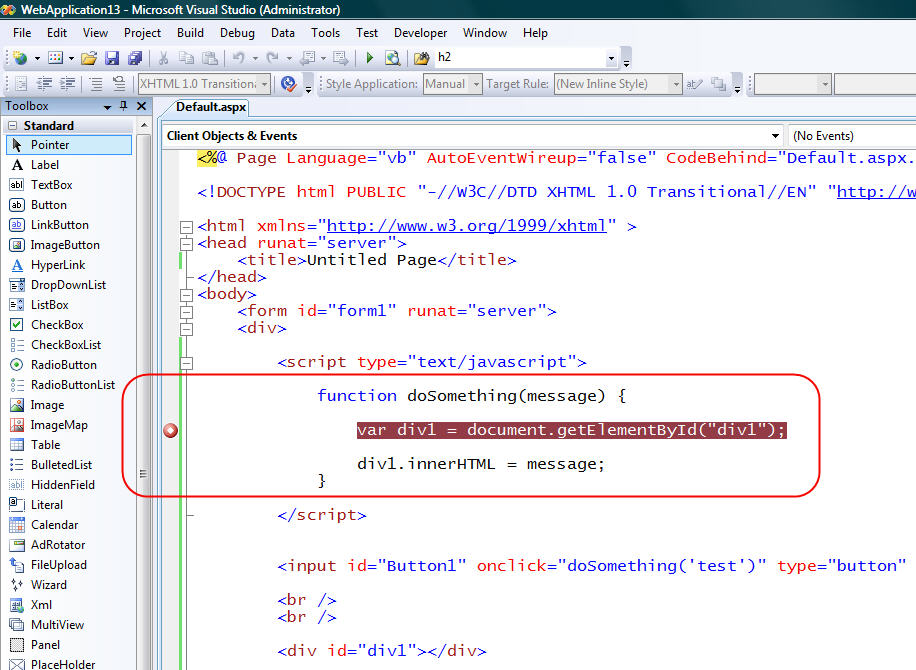
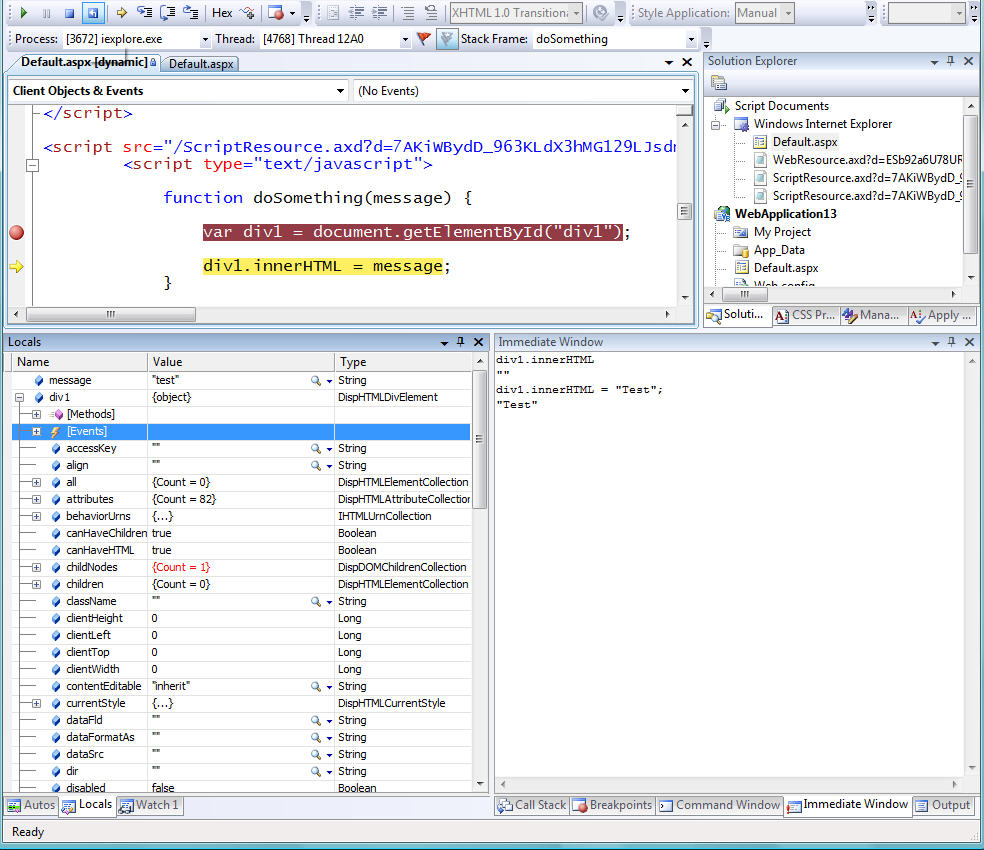
When you set a breakpoint in your .aspx page like above, VS 2008 will automatically map the breakpoint location to the dynamically generated client HTML that runs in the browser when the page is later executed:
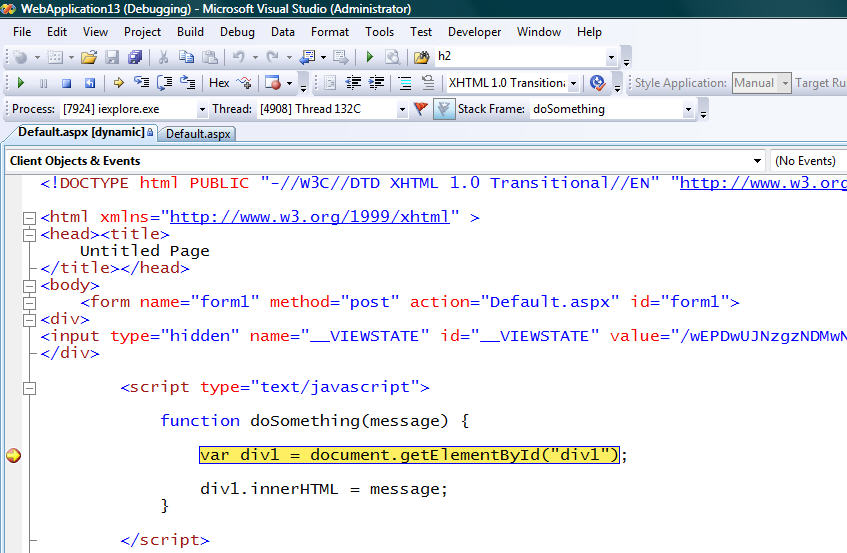
If you add/remove/update the breakpoint locations in the running HTML document, VS 2008 is also now smart enough to perform the reverse mapping and update the breakpoint in the original .aspx or .master source file on the server. This makes it much easier to get into a nice edit/debug/edit/debug flow as you are iterating on your applications.
Best of all, you can now set both client-side JavaScript breakpoints and VB/C# server-side breakpoints at the same time (even in the same page) and use a single debugger to step through both the server-side and client-side code in a single debug session (which is extremely useful for any AJAX heavy application).
Any JavaScript breakpoints you set will also now by default be saved by VS 2008 when you close the project/solution. When you open up the project again, the previous locations you set the breakpoints on will still have them enabled.
Script Document Navigation within the Solution Explorer
Often the JavaScript that is sent down to a browser client is dynamically generated on the server (for example: with scripts that are stored as resources within compiled server controls - like ASP.NET AJAX UpdatePanels and control extenders). In scenarios such as these, you want to be able to easily see all JavaScript URLs being loaded from a page, as well as step into the within the debugger.
VS 2008 makes it much easier to-do this by integrating the running Script Document feature (that in VS 2005 was a separate tool-pane window) into the VS 2008 solution explorer view when you are debugging a web application.
Specifically, when you are using VS to run and debug a page, VS 2008 will now list all of the script URLs that the page you are debugging has loaded in the browser at the top of your VS solution explorer pane:
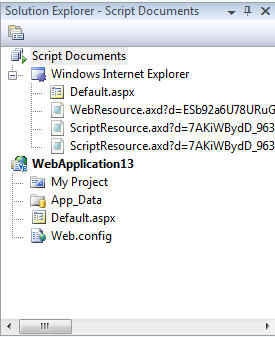
You can then double click on any of the URLs under the "Script Documents" node at the top to see the JavaScript file that was loaded in the page:
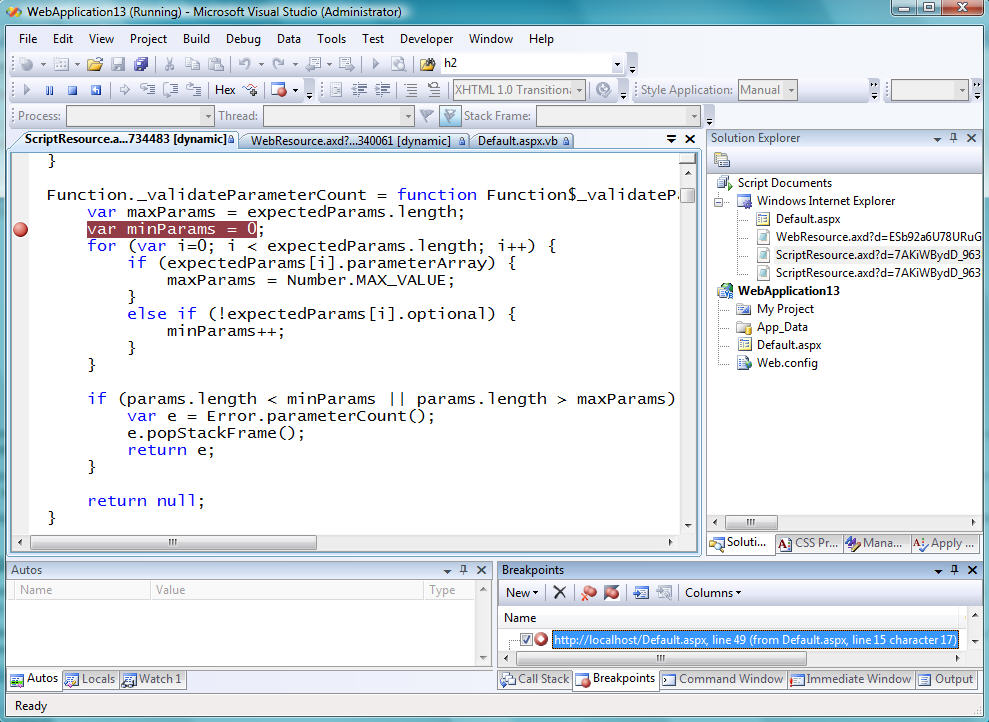
You can obviously then set breakpoints in the loaded JavaScript and debug everything.
Much Richer Debug Watch/Locals and Visualizer Support
Easily opening and navigating JavaScript files in the debugger is nice - but the real meat of the improvements made with VS 2008 JavaScript debugging is in the much improved object execution and inspection support. When you inspect a variable within the debugger using VS 2008, you'll find much more detailed object information is now available:
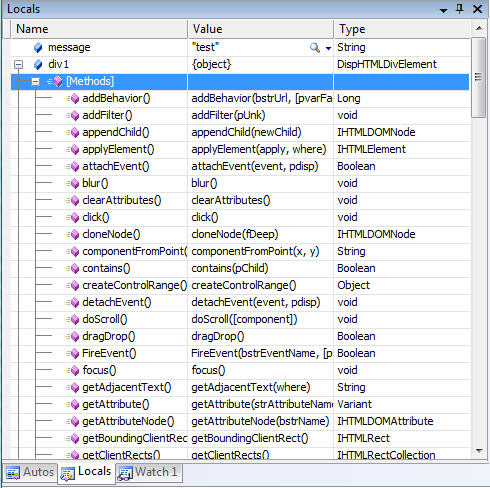
You can now browse runtime object methods:
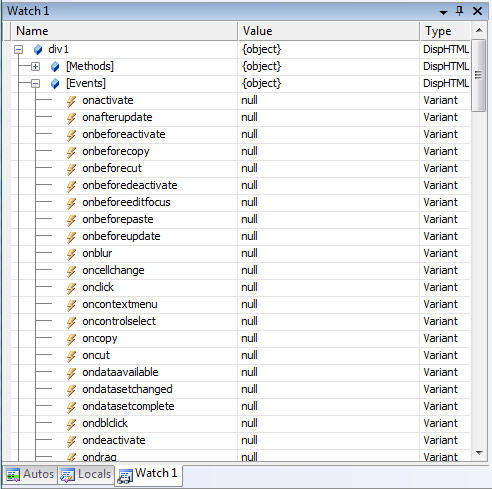
You can now browse runtime object events:
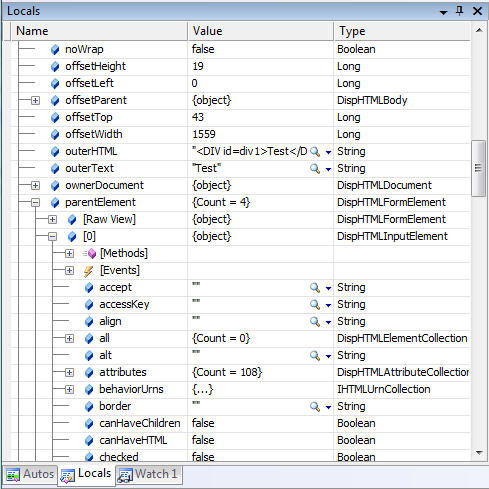
And you now get much, much more detailed property and property type information of running objects. Note below how I am traversing the div element's "parentElement" property to dynamically look up details about the element's parent HTML element and overall position within the HTML DOM:
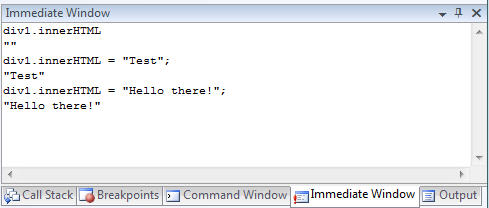
You can obviously use the debugger property grid above to both lookup as well as set values. You can also run code in the immediate window to retrieve and change JavaScript at runtime:
VS 2008 also provides support for pluggable debug visualizers that you can use with JavaScript debugging. This enables developers to add extensions to the debugger that can work against running objects and provide richer visualization views of them. For example, we could use the built-in "Text", "XML", or "HTML" visualizer to load a dialog to better inspect a value:


I suspect we might see a cool CodePlex project providing nice JSON and REST JavaScript visualizers soon.
Summary
The above walkthrough hopefully provided a good overview of some of the new JavaScript debugging features coming soon. There are many more JavaScript and AJAX features coming in VS 2008 and .NET 3.5 that I'll be covering in future blog posts.
Note that because of the new VS 2008 multi-targeting support, you can use the JavaScript debugging features above with both ASP.NET applications built using .NET 3.5 (which also now has ASP.NET AJAX built-in), as well as with existing ASP.NET 2.0 applications (including ones that use the separate ASP.NET AJAX 1.0 download). This, combined with the new VS 2008 JavaScript intellisense support, provides a very compelling reason to start using VS 2008 - even if you are using it to only target .NET 2.0 applications.
Hope this helps,
Scott
P.S. To learn more about VS 2005 JavaScript Debugging, please read this blog post. Dan Wahlin also recently posted a nice set of AJAX testing and debugging tools that I recommend checking out here.