Announcing the release of Windows Azure SDK 2.0 for .NET
This morning we released the v2.0 update of the Windows Azure SDK for .NET. This is a major refresh of the Windows Azure SDK with some really great new features and enhancements. These new capabilities include:
- Web Sites: Visual Studio Tooling updates for Publishing, Management, and for Diagnostics
- Cloud Services: Support for new high memory VM sizes, Faster Cloud Service publishing & Visual Studio Tooling for configuring and viewing diagnostics data
- Storage: Storage Client 2.0 is now included in new projects & Visual Studio Server Explorer now supports working with Storage Tables
- Service Bus: Updated client library with message pump programming model support, support for browsing messages, and auto-deleting idle messaging entities
- PowerShell Automation: Updated support for PowerShell 3.0, and lots of new PowerShell commands for automating Web Sites, Cloud Services, VMs and more.
All of these SDK enhancements are now available to start using immediately and the SDK can now be downloaded from the Windows Azure .NET Developer Center. Like all of the other Windows Azure SDKs we provide, the Windows Azure SDK for .NET is a fully open source project (Apache 2 license) hosted on GitHub.
Below are more details on the new features and capabilities released today:
Web Sites: Improved Visual Studio Publishing
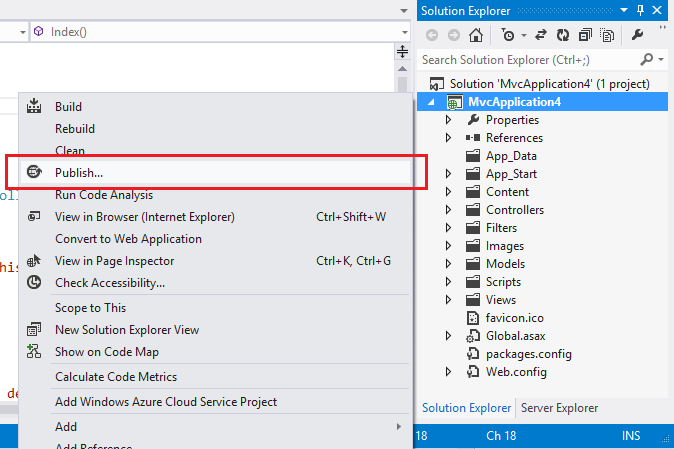
With today’s release we’ve made it even easier to publish Windows Azure Web Sites. Just right-click on any ASP.NET Web Project (or Web Site) within Visual Studio to Publish it to Windows Azure:
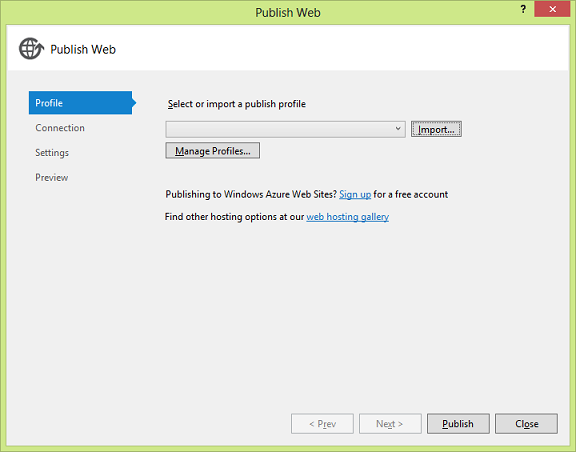
This will bring up a publish profile dialog the first time you run it on a project:
Clicking the import button will enable you to import a publishing profile (this is a one-time thing you do on a project – it contains the publishing settings for your site in Windows Azure).
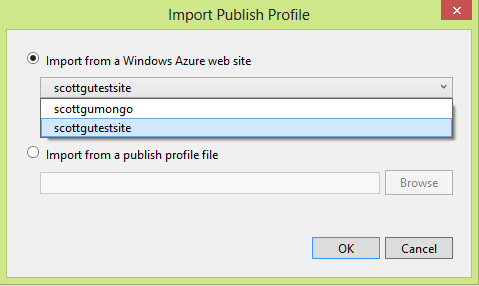
With previous SDK releases you had to manually download the publish profile file from the Windows Azure Management Portal. Starting with today’s release you can now associate your Windows Azure Subscription within Visual Studio – at which point you can browse the list of sites in Windows Azure associated with your subscription in real-time, and simply select the one you want to publish to (with no need to manually download anything):
Then just select the Web Site on Windows Azure that you want to deploy your app to, hit ok, and your app will be live on Windows Azure in seconds. You can then quickly republish again (also in seconds) without having to configure anything (all of the publish profile settings are persisted for later use).
Web Sites: Management Support within the Visual Studio Server Explorer
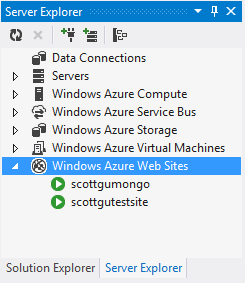
Today’s SDK release also adds new support for managing Web Sites, deployed in the cloud with Windows Azure, through the Visual Studio Server Explorer. When you associate your Windows Azure subscription with Visual Studio, you’ll now see all of your running web sites within Windows Azure in the Visual Studio Server Explorer:
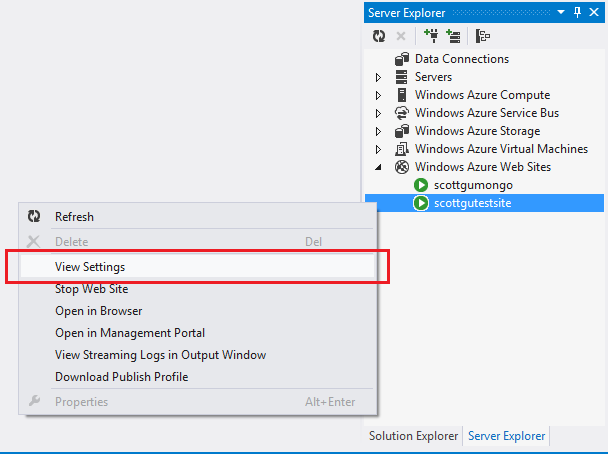
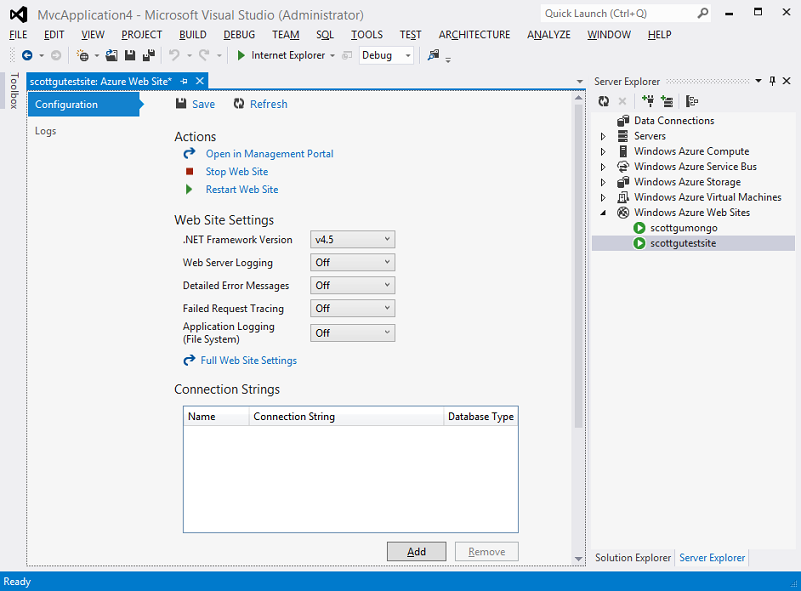
In addition to listing your sites, you can also perform common operations on them like Starting/Stopping them (just right click on one to do this). You can also use the View Settings command on a site to retrieve the live site configuration settings from Windows Azure:
When you do this you’ll be able to view and edit/save the live settings of the Web Site directly within Visual Studio. These settings are being pulled in real-time from the running Web Site instance in the cloud within Windows Azure:
Changes you save here will be persisted immediately into the running instance within Windows Azure. No need to redeploy the application nor even open the Windows Azure Management Portal.
Web Sites: Streaming Diagnostic Logs
One of the really awesome new features in today’s release is support that enables you to stream your Windows Azure Web Site’s application logs directly into Visual Studio. This is a super useful feature that enables you to easily debug your Web Site when it is running up in the cloud in Windows Azure.
How to Enable Live Streaming of Diagnostic Logs
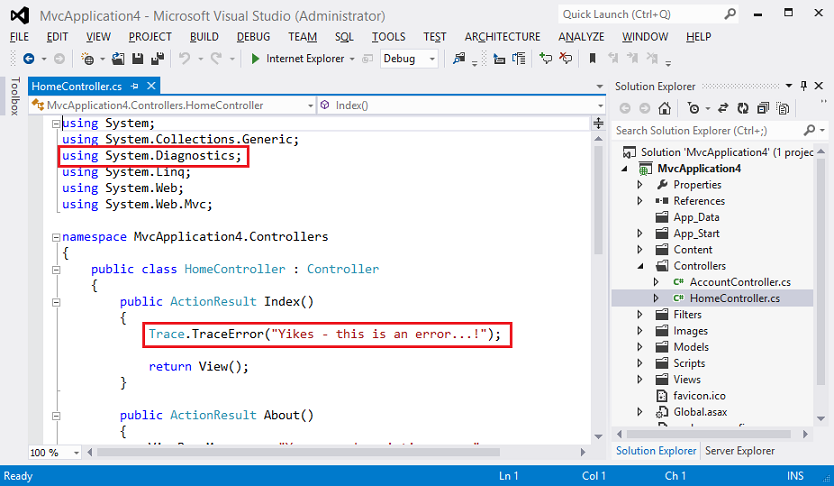
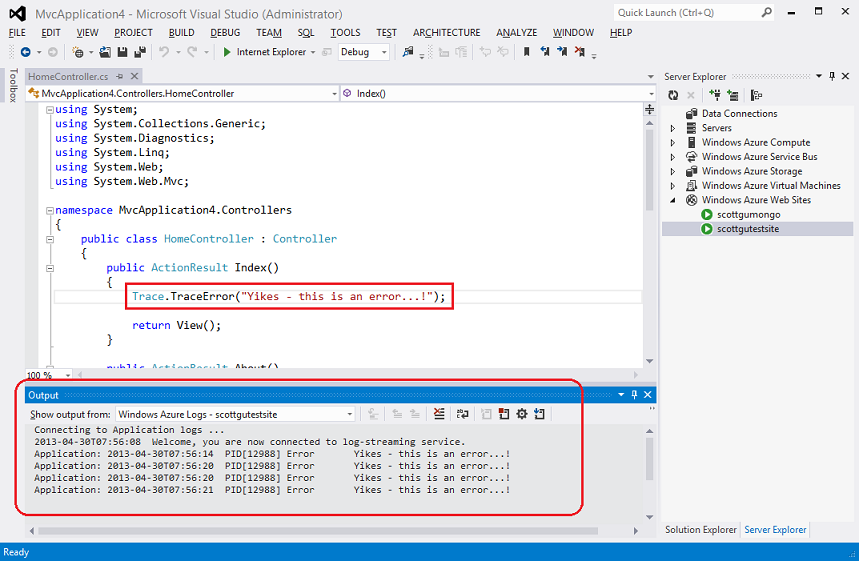
To try out this feature, we’ll first add a Trace statement to an ASP.NET Web application and publish it to Windows Azure (as a Web Site). We’ll add the trace statement to our app using the standard System.Diagnostics tracing API in .NET. We’ll use the Trace.TraceError() method to write out an error:
By default when we hit the Web Site this method will do nothing – because tracing is disabled by default on Web Sites.
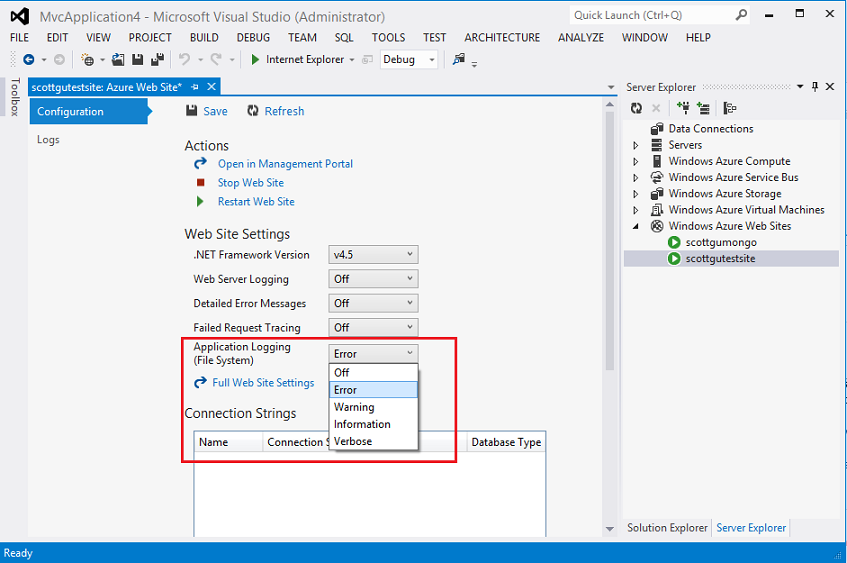
If we want to enable tracing on our Web Site (in order to debug something) we can do that through the Windows Azure Management Portal (click the Configuration tab within a Web Site to enable this in the portal). Or alternatively we can now do this directly within Visual Studio using the View Settings command within Server Explorer (like we saw above):
Notice above how we are enabling Application Logging for our Web Site, and turning it on so that it logs all “Error” trace events. Make sure “Error” is selected and then click the “Save” button to persist the setting to Windows Azure – at which point we can hit our Web Site again and this time our Trace Error statements will be saved.
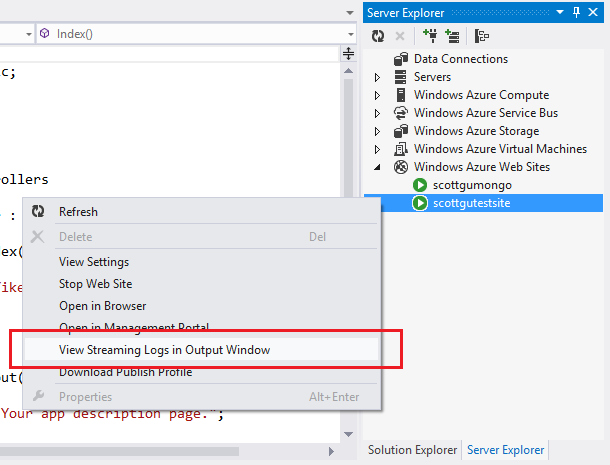
To view the trace statements inside Visual Studio we then simply need to click on our Web Site within the Server Explorer and select the View Streaming Logs in Output Window command:
This will open our Visual Studio output window – which will display the Trace.TraceError() statements as they execute in our live site (there is only a ~2 second delay from the time it executes to the point it shows up in our Visual Studio output window – which is super convenient when trying to debug something):
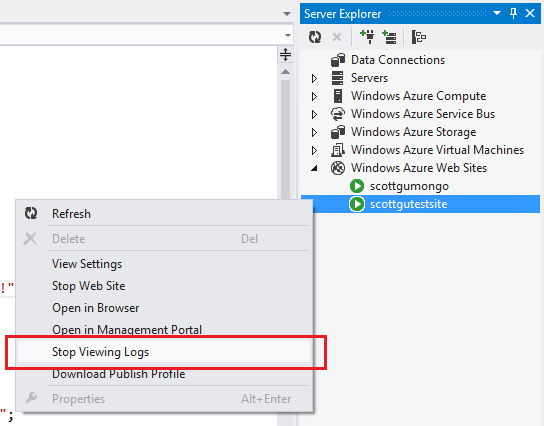
When you are done debugging the issue, just right-click on the Web Site again and choose the Stop Viewing Logs command to stop the logs being sent to VS (and when you are done with the issue itself make sure to turn off logging entirely by going back to the settings window and disabling it):
The above support is super useful and makes it much easier to debug issues that only occur in a live Windows Azure environment. For more information on this feature (and how to use it from the command-line) check out this blog from Scott Hanselman.
Note: You must have a /LogFiles/Application directory in your Windows Azure Web Site before you can stream the application logs to Visual Studio. This gets created the first time a trace statement gets written to disk – so you’ll want to make sure you execute a Trace statement first before opening up the log streaming view inside Visual Studio. We’ll be making an update to Windows Azure Web Sites in the next week or two which will cause this directory to be automatically created for you – both for existing and new web sites. This will enable you to start streaming the logs even before a trace operation has occurred. Until then just make sure you have written one trace statement before you start the log streaming window in VS.
Cloud Services: Support for High Memory VM Instances
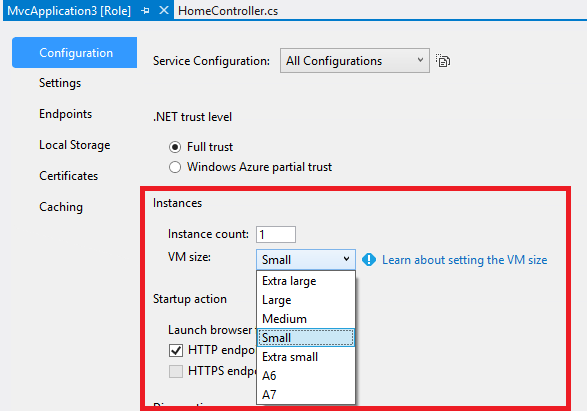
Two weeks ago we announced the general availability of our Windows Azure IaaS release. Included as part of that release was support for creating large memory IaaS VMs using our new 4 core x 28GB RAM (A6) and 8 core x 56GB RAM (A7) VM sizes.
Starting with today’s Windows Azure SDK 2.0 for .NET release, you can also now deploy your Cloud Services to these same VM sizes:
For details on the VM sizes please refer to: http://msdn.microsoft.com/en-us/library/windowsazure/dn197896.aspx
Cloud Services: Faster Deployment Support with Simultaneous Update Option
Today’s release includes a number of enhancements to improve the deployment and update times of Cloud Services.
One of the new deployment options we now support is the ability to do a “Simultaneous Update” of a Cloud Service (we sometimes also refer to this as the “Blast Option”). When you use this option we bypass the normal upgrade domain walk that is done by default with Cloud Services (where we upgrade parts of the Cloud Service sequentially to avoid ever bringing the entire service down) and we instead upgrade all roles and instances simultaneously. With today’s release this simultaneous update logic now happens within Windows Azure (on the cloud side). This has the benefit of enabling the Cloud Service update to happen much faster.
Note that because it updates all roles simultaneously you want to be careful about using it in production for normal updates (otherwise users will experience app downtime). But it is great for scenarios where you want to quickly update a dev or test environment (and don’t care about a short period of downtime between your updates), or if you need to blast out a critical app update fast in production and you are ok with a short availability impact.
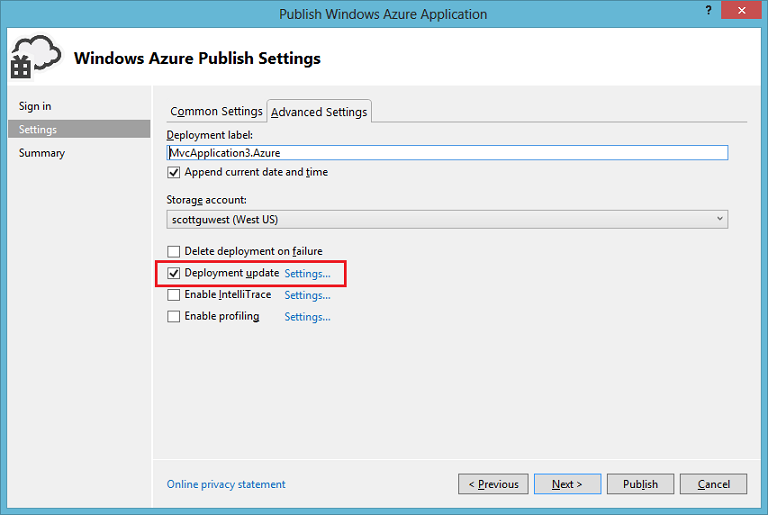
To perform a Simultaneous Update using Visual Studio, select the “Advanced Settings” tab within the Cloud Service Publish wizard and choose the “Settings” link next to the Deployment Update checkbox:
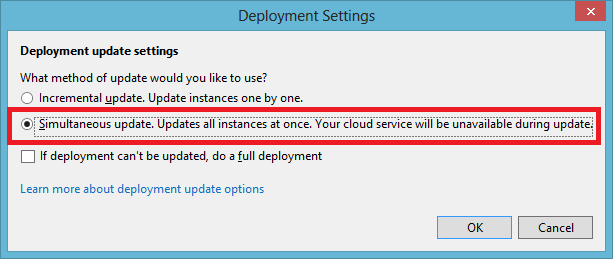
This will launch a new dialog. Within it you can now select the new “Simultaneous Update” option:
Once saved, the updates to this Cloud Service will be performed using this option and all roles and instances will be updated simultaneously.
Cloud Services: Improved Diagnostics Support
Today’s release also includes some major enhancements to our diagnostics support with Cloud Services.
Easily Configure Diagnostics
Visual Studio has enabled Windows Azure Diagnostics for several versions. With today’s Windows Azure .NET SDK release we are making it even easier to start with the right diagnostics collection plan and leverage the data it provides to find errors and other useful information about your live service.
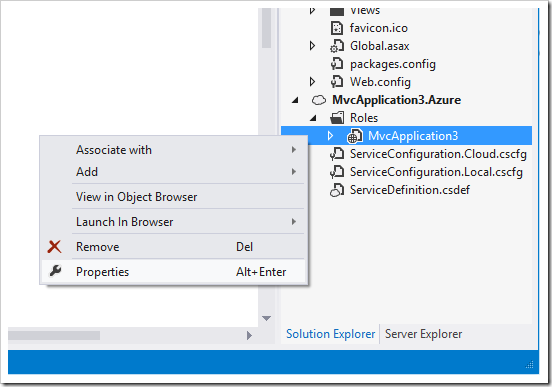
You can right-click on a Cloud Service role within Visual Studio’s Solution Explorer to pull up Configuration about it:
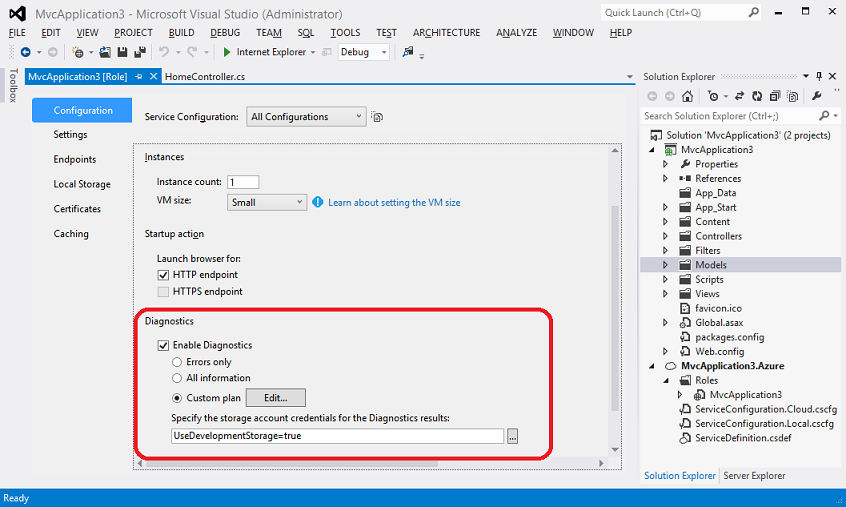
Today’s SDK release includes an updated Diagnostics section within it:
You can use this updated Diagnostics section to configure how you want to collect and store errors captured by the default .NET trace listener and your Trace.TraceError() code – all without having to write any glue code to setup or initialize. You can specify the collection plan you want to use at runtime: Errors Only [default], All Information or a Custom Plan. The custom plan is pretty rich and enables fine grain control over error levels, performance counters, infrastructure logs, collection intervals and more.
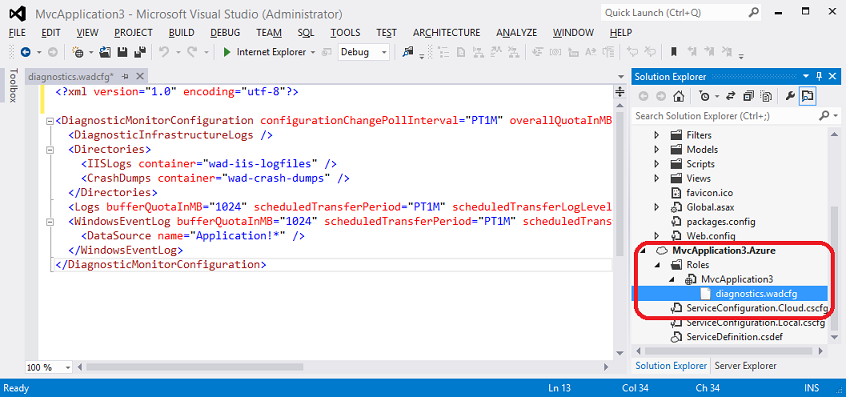
The diagnostics plan you configure through the configuration UI above is persisted in a diagnostics.wadcfg XML file. If you open the Cloud Service role node within the Server Explorer you can find it and optionally edit the settings directly within the text editor:
Because the file is saved with your source code it can be managed under source control. It is also deployed with your cloud service and can be changed post deployment without requiring an application redeploy (I cover how to enable this live update below).
View Diagnostics on a Live Service
With today’s release we are also making it really easy for developers to review the live diagnostics data from their Cloud Services directly within Visual Studio – as well as dynamically turn on or off more detailed diagnostic capturing on their Cloud Services without having to redeploy the Cloud Service (which makes it much easier to quickly debug live production issues).
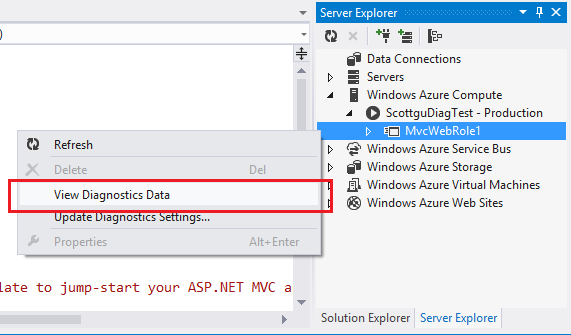
For any published Cloud Service, you can now view a quick summary of live service errors and other important status by clicking the View Diagnostics Data command in Visual Studio – which is surfaced off of each role node within a Cloud Service in the Visual Studio Server Explorer:
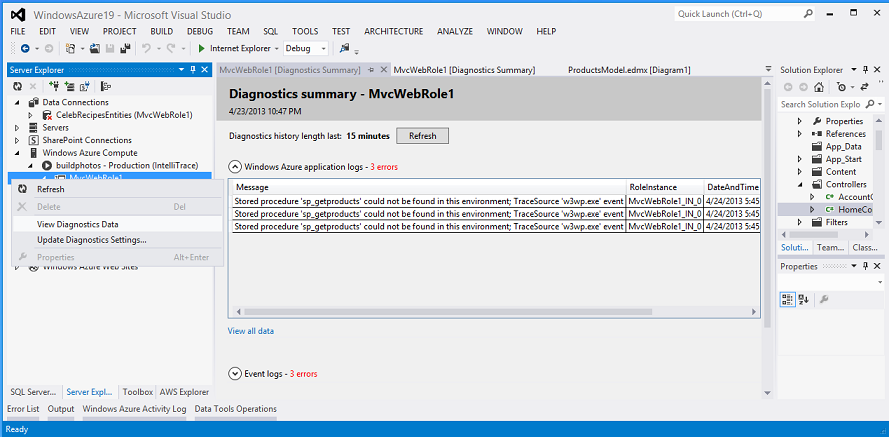
Executing this command will query the diagnostics table for the Cloud Service within Windows Azure and list a quick summary view of recent data within it. In the example below we can see that we forgot to update the app’s configuration pointing to our SQL DB and therefore our stored procedure calls are failing in the deployed service:
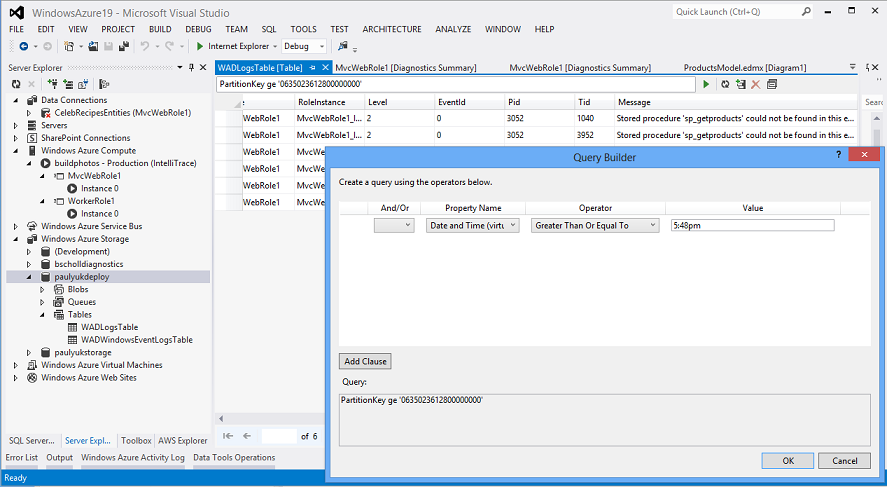
Even more detailed diagnostics data has been gathered and stored in the Cloud Service’s Diagnostics Storage account. Click the View all Data link to drill into it. This loads a new Windows Azure Storage Table viewer. You can make use of the Query Builder support in it to refine your view over the diagnostics data. In the following example we are filtering a window of time occurring after 5:48pm by querying over the TimeStamp(Virtual). This refers to the time it occurred in the service rather than the time the data was collected and transferred.
This makes it much easier for you to look through historical logs to try and identify what the issue is.
Update Diagnostics Settings on a Live Service
Visual Studio also now enables you to configure and update the diagnostics settings for running Cloud Service directly from Server Explorer. Diagnostic configuration can be updated at any time without the need to add code to your project and without having to redeploy the Cloud Service (which makes it much easier to quickly debug live production issues).
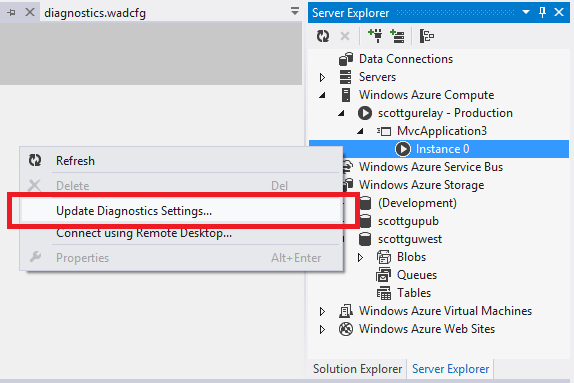
To do this, use the Server Explorer –> Windows Azure Compute node to select a running role instance in Windows Azure, and then click the Update Diagnostics Settings command on it to configure the runtime diagnostics settings for it:
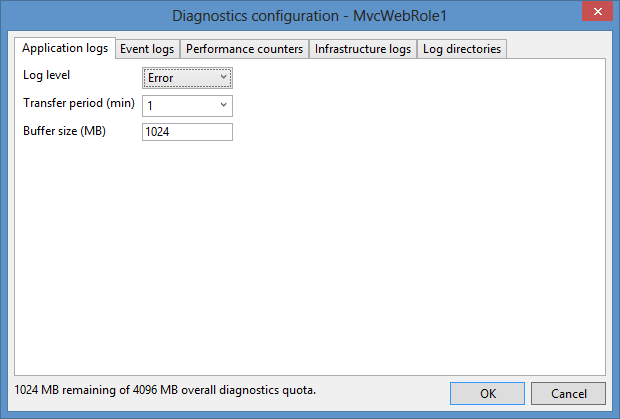
Selecting this command will bring up a dialog that allows you to view and edit the Diagnostics Settings for the role. Note that we can dynamically change the application log collection settings, event logs, performance counters, Infrastructure logs (like IIS, etc), and more:
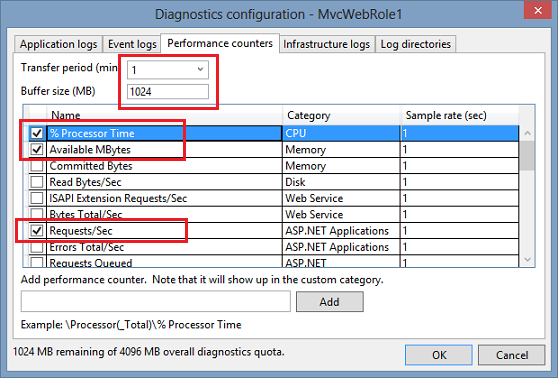
In this example we will collect information about available memory + CPU + Requests/sec on the role from a performance counter. We’ll do this by selecting the Performance Counters tab and selecting the appropriate counter within it. In addition to selecting the performance counters we want to track, we also need to set a Transfer period (in minutes) and Buffer size (MB). We’ll set these to be 1 minute and 1024 MB (if we don’t set these then the logs won’t be copied to our storage account):
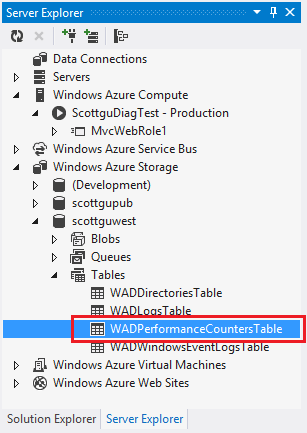
When we click OK, the collection plan will immediately be applied to the live role instances, and we’ll start collecting the new data we specified. Within about a minute we’ll see a new WADPerformanceCountersTable created in our storage account, and our performance monitor data will start to be collected in it:
Double clicking the above table would enable us to browse and review the performance monitor data.
Being able to dynamically turn on/off this functionality at runtime (without having to redeploy the Cloud Service) is super useful. If we wanted to change the collection plan long term for every subsequent deployment, we can just apply the configuration changes we make at runtime back in the role designer for the cloud service project (or check it into source control). That way new Cloud Service deployments will get it by default.
More Information
The above diagnostics support is really powerful, and can be used to capture diagnostic data from any number of roles and instances within a Cloud Service (including both web and worker roles). And it makes it even easier to debug and analyze issues within multi-tier deployments.
Note that the .NET Diagnostics Listener support to output trace statements to Windows Azure’s diagnostics agent is enabled by default when you create new Cloud Service projects within Visual Studio. If you start with an existing ASP.NET Web Project and then later convert it to be a Cloud Service you’ll want to manually add the below trace listener registration code to your web.config file in order to enable the above diagnostics support:
<system.diagnostics>
<trace>
<listeners>
<add type="Microsoft.WindowsAzure.Diagnostics.DiagnosticMonitorTraceListener, Microsoft.WindowsAzure.Diagnostics, Version=2.0.0.0, Culture=neutral, PublicKeyToken=31bf3856ad364e35"
name="AzureDiagnostics">
<filter type="" />
</add>
</listeners>
</trace>
</system.diagnostics>
Storage: Visual Studio Table Explorer
With the previous Windows Azure SDK 1.8 release we revamped the Visual Studio tooling support for Windows Azure Storage. This previous release focused on read/write features for the Windows Azure Storage Blob and Queue services.
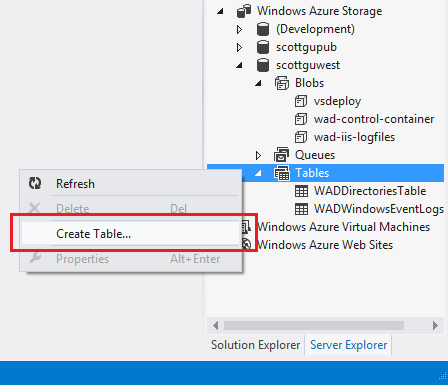
With today’s Windows Azure SDK 2.0 release, you can also now create and delete Windows Azure Tables, and add/edit/delete table entities in them from the Visual Studio Server Explorer. This saves you time and allows you to easily use Visual Studio to build apps that use Windows Azure Storage Tables.
Within the Visual Studio Server Explorer, simply right-click within the Windows Azure Storage node to create and name a new Table:
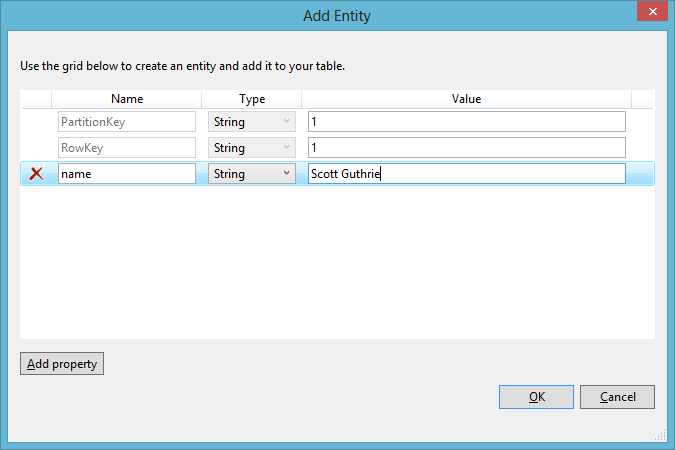
Once you have the table created, you can then optionally add entities to it directly within Visual Studio (just click the “Create Entity” button on the table designer):
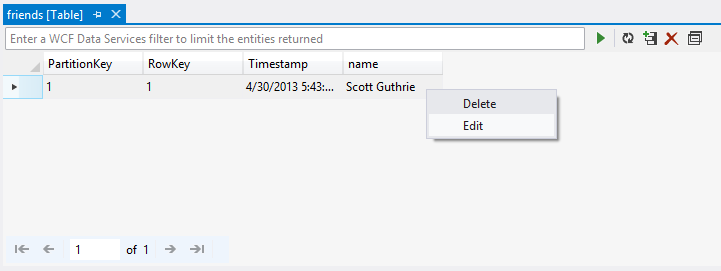
You can also edit/delete existing entities within Tables:
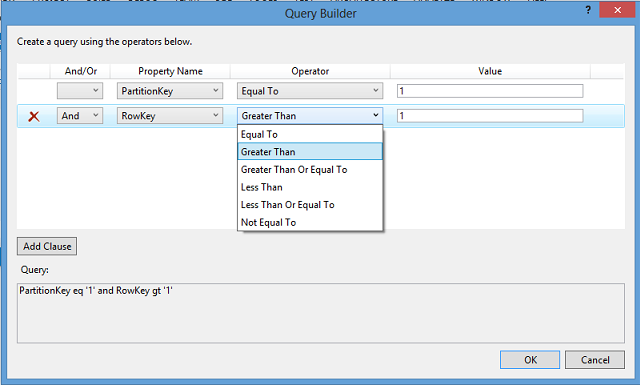
We also now make it much easier to build Table queries - without requiring expertise with OData syntax - using a new Query Builder available as part of the Table tooling:
The above features make it much easier to use Windows Azure Storage Tables.
Service Bus: Updated Client Library
Today’s release also includes an updated Service Bus client library with several great new features:
- Message Browse Support: Message browsing enables you to view available messages in a queue without locking the message or performing an explicit receive operation on it. This is very useful for debugging scenarios, and in scenarios that involve monitoring.
- New Message Pump Programming Model: Today’s release also adds support for a new message pump programming model. The Message Pump programming semantics are similar to an event-driven, or “push” based processing model and provides an alternative to the receive loop which we support today. This approach supports concurrent message processing, and enables processing messages at variable rates.
- Auto-delete for Idle Messaging Entities: Auto-delete enables you to set an interval after which an idle queue, topic, or subscription is automatically deleted.
PowerShell: Tons of new Automation Commands
With today’s release, Windows Azure PowerShell (which is a separate download) has moved to support PowerShell 3.0. Today’s release also includes numerous new PowerShell cmdlets that enable you to automate Windows Azure Web Sites, Cloud Services, Virtual Machines, as well as application services including Service Bus and the Windows Azure Store. You can find the full change log here.
Below are a few examples of some of the new functionality provided:
Web Sites
You can now get streaming logs for both http and application logs from your PowerShell console via the following command:
>>> Get-AzureWebsiteLog <your website> –Tail
Cloud Services
You can now use a faster deployment option by opting into a simultaneous upgrade option which will upgrade all web and worker roles in parallel:
>>> Set-AzureDeployment –Mode Simultaneous
Virtual Machines
You can now use the new high memory virtual machine A6 & A7 images with these two commands:
>>> New-AzureVM
>>> New-AzureQuickVM
We also enabled PowerShell Remoting by default when you create a VM via PowerShell to enable you to easily run your PowerShell cmdlets or scripts against your newly created virtual machines in Azure.
Service Bus
You can now manage Service Bus namespaces via newly added cmdlets which allow you to create, list and remove Service Bus namespaces.
Windows Azure Store
You can now manage your Azure Store add-ons from PowerShell. You can list the available add-ons, purchase an add-on, view your purchased add-ons and also upgrade the plan on a purchased add-on.
For example, the below command would create and deploy a MongoDB service from MongoLab (one of our Windows Azure Store partners):
>>> New-AzureStoreAddOn myMongoDB –AddOn mongolab –plan free –Location “West US”
Storage
We now support blob CRUD operations via PowerShell which allow you to manage Storage blob containers, upload/download blob content, and copy blobs around. This enables you to create scripts to seed some initial data for your applications or check what is in your storage account quickly when you are developing your application.
Scaffolding cmdlets for Web/Worker Role
We have also added new cmdlets for scaffolding. You can now use Add-AzureWebRole and Add-AzureWorkerRole to create projects for general web/worker role. You can use New-AzureRoleTemplate to generate a customized role template which you can use in Add-AzureWebRole or Add-AzureWorkerRole via the –TemplateFolder parameter.
More Information
A few other updates/changes with today’s release:
- WindowsAzure.Diagnostics.dll no longer depends on WindowsAzure.StorageClient.dll. You will now be able to import and use the WindowsAzure.Storage 2.0 NuGet package in your application without introducing conflicts with Diagnostics.
- Windows Azure SDK 2.0 supports side by side with Windows Azure SDK 1.8 and 1.7 while dropping support for side by side with Windows Azure SDK 1.6. Therefore you will not be able to debug an SDK 1.6 service if SDK 2.0 is installed on the same machine.
- WindowsAzure.ServiceRuntime.dll, WindowsAzure.Configuration.dll and the caching assemblies are now built against the .Net framework 4.0 runtime. Therefore you will have to retarget your framework 3.5 application to 4.0 after migrating to Windows Azure SDK 2.0.
- We also recently published Windows Azure Cloud Service Support Policy which you can view in detail at http://support.microsoft.com/gp/azure-cloud-lifecycle-faq.
Learn More
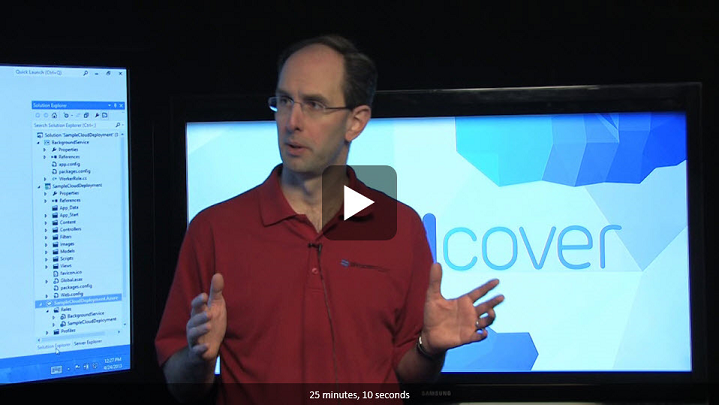
You can also learn more about today’s SDK release, and see some demos of it in action, from my visit to this week’s latest Cloud Cover Show on Channel9:
Summary
Today’s release includes a bunch of great features that enable you to build even better cloud solutions. If you don’t already have a Windows Azure account, you can sign-up for a free trial and start using all of the above features today. Then visit the Windows Azure .NET Developer Center to learn more about how to build apps using today’s SDK release.
Hope this helps,
Scott
P.S. In addition to blogging, I am also now using Twitter for quick updates and to share links. Follow me at: twitter.com/scottgu
