Debugging Classic ASP with Modern Visual Studio
Recently I tried to show my Mom some websites I built when I was a kid. Those ASP code, some in VBScript while some in JavaScript, are more than 10 years old. They were running fine in PWS, but now they didn’t run in IIS 8.5. I have no idea what’s the problem. It seems a little debugging has to be done.
Debugging with Visual Studio 2013/2015/2017 and IIS Express
I have Windows 8.1 and Visual Studio 2013 (Later I have Windows 10 and Visual Studio 2015/Visual Studio 2017). Surprisingly, I found that IIS Express supports ASP:
In addition to supporting ASP.NET, IIS Express also supports Classic ASP and other file-types and extensions supported by IIS – which also makes it ideal for sites that combine a variety of different technologies.
After searching and trying things around, using Visual Studio and IIS Express seems to be the easiest way to run and debug ASP websites:
- Modify IIS Express configuration. Open %USERPROFILE%\Documents\IISExpress\config\applicationhost.config. Under <system.webServer>, find <asp>:
<asp scriptErrorSentToBrowser="true">
    <cache diskTemplateCacheDirectory="%TEMP%\iisexpress\ASP Compiled Templates" />
    <limits />
</asp>
and change it to:<asp scriptErrorSentToBrowser="true" enableParentPaths="true" bufferingOn="true" errorsToNTLog="true" appAllowDebugging="true" appAllowClientDebug="true"> <cache diskTemplateCacheDirectory="%TEMP%\iisexpress\ASP Compiled Templates" /> <session allowSessionState="true" /> <limits /> </asp>
- In Visual Studio, add existing website to the solution (or open a website), point to the ASP website folder.
- Start the website without debugging (Ctrl+F5).I will explain why.
- In Visual Studio, open the “Attach to Process” dialog (Ctrl+Alt+P). Notice the “Attach to” has the default option “Automatic: Native code”
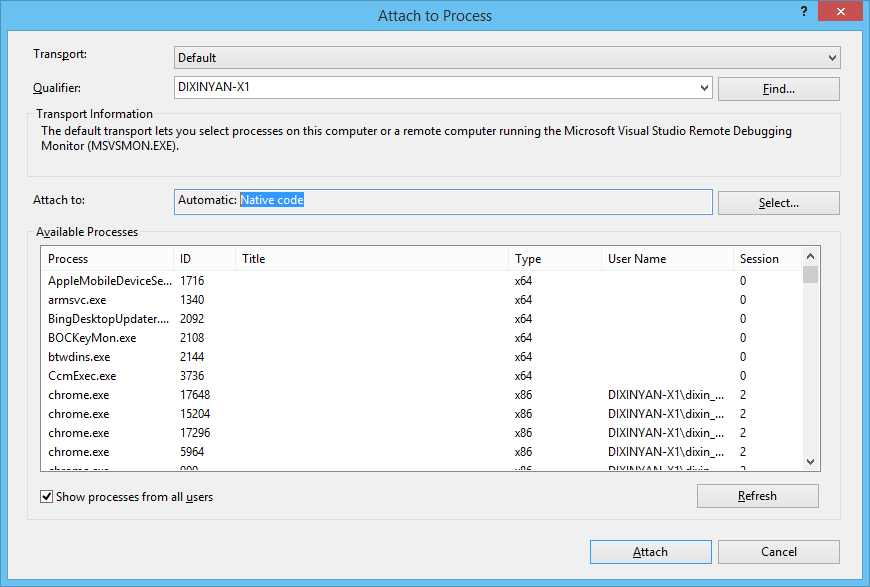
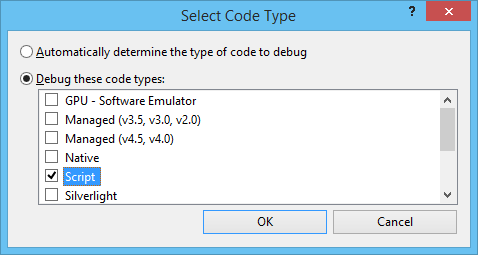
- Click the “Select…” button, change it to “Script”:
- Now attach to IIS Express:
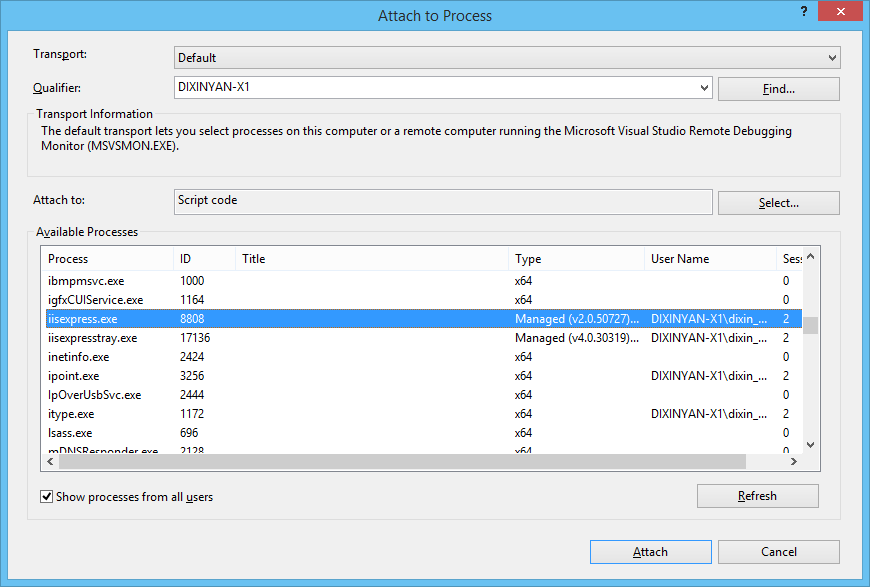
- If IIS Express is running multiple websites, there will be multiple iisexpress.exe processes in the “Available Processes”. The current website’s process ID can be found
from the IIS Express site list: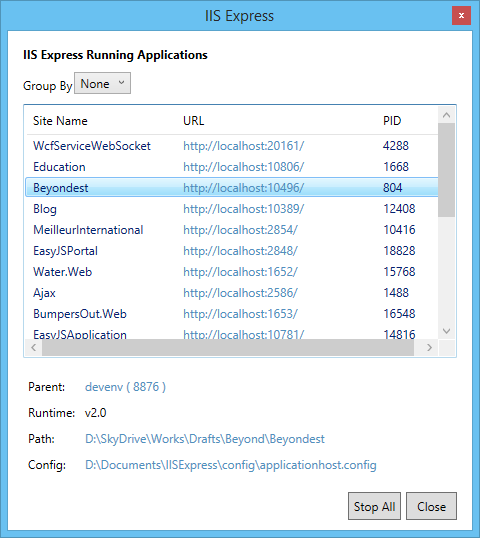
Now the website can be debugged in Visual Studio:
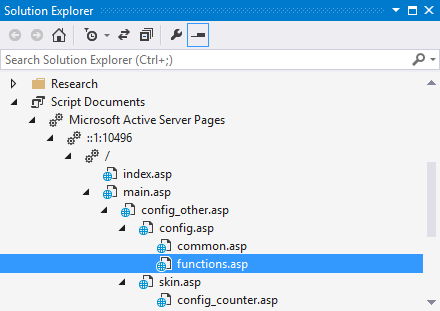
And Solution Explorer shows the triggered .asp files, and how each .asp file includes other files.
However, if the website is directly started with debugging (F5), Visual Studio will attach to native code or managed code. We have to start the website then manually attach to script code, as MSDN mentions:
When you debug script, Managed code must not be selected. You cannot debug script and managed code at the same time in Visual Studio 2005.
This is why in Step 4 we do not start
As the second last picture shows, the index.asp has a [dynamic] tag. Visual Studio does not automatically map it to index.asp from the file system. This means, if a breakpoint is set in a *.asp file, it won’t trigger when running the website. You may have to go back and forth between dynamic file and static file. To have the mapping automatically, IIS is needed.
Debugging with Visual Studio 2013/2015 and IIS
Here are the steps:
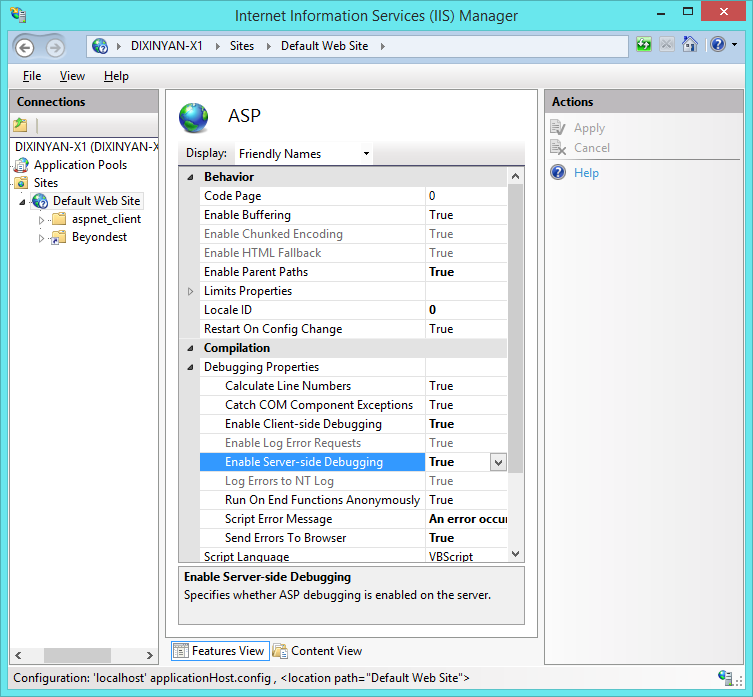
- Open IIS manager, change ASP configurations to enable debugging:
- Run Visual Studio as administrator.
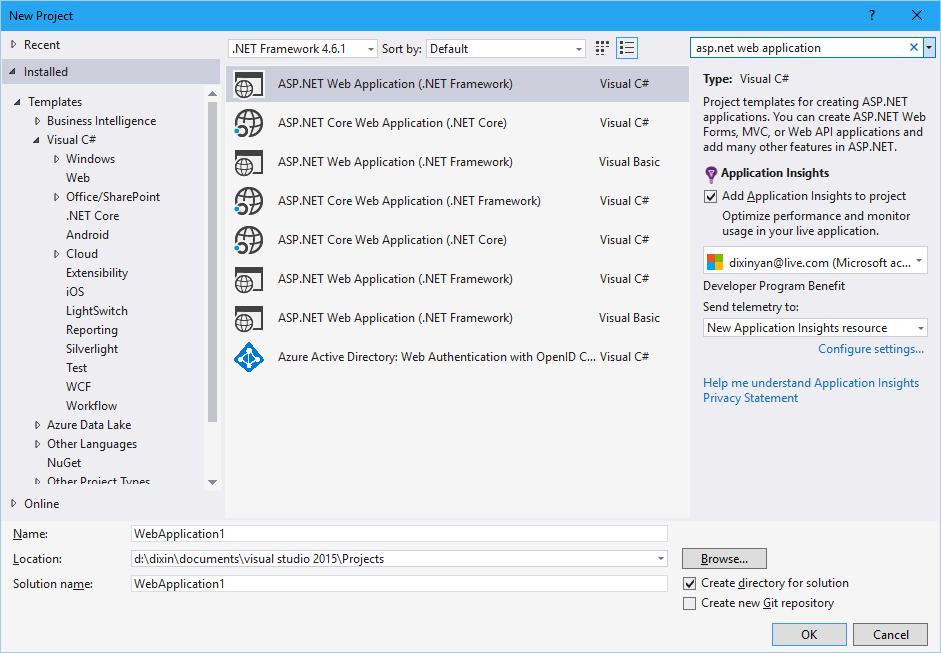
- Create an empty web application. In Visual Studio 2015, click File –> New –> Project…, then in the new project dialog, search “ASP.NET Web Application”. A WebApplication.csproj file and Web.config file will be created in the web application directory.

- Merge website folder to Visual Studio web application folder. In Visual Studio, include all website files into the created empty web application.
- In web application project’s properties, go to Web tab, choose “Local IIS”, create
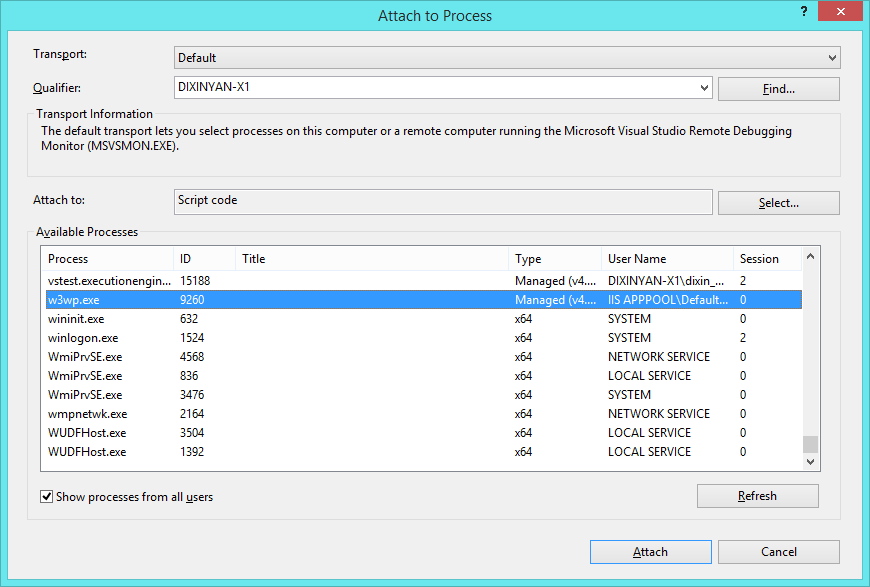
virtual directory in local IIS for this web application. - In the “Attach to Process” dialog, attach Visual Studio to “Script Code” of IIS process (w3wp.exe).
- Manually start a browser, input the URI of the created virtual directory. Now the breakpoint set in the static .asp file triggers.
With this approach, the created


