Azure Service Bus Client Performance Counters
Identifying issues is never trivial. It is even harder when the problem is hidden, and there's are no logs or traces to go through.
Application using Azure Service Bus started to throw an exceeded quota exception for the number of concurrent connections the broker permits for a namespace, which is 1000. I needed a way to confirm if the application is the source of exhausting the connections or not.
Gladly, there's a hidden gem with ASB - client performance counters. It is packed with various informative counters that could provide vital information on how your system performs. Including a counter for connections, the application could be leaking.
1. Getting ASB client performance counters
To get the performance counters installed, WindowsAzure.ServiceBus.PerformanceCounters package is required. The package is content only package and contains the registration script RegisterMessagingPerfCounter.cmd and the manifest files required for the script to work.
Having this package only will not suffice as the manifest (``) requires the Microsoft.ServiceBus.dll, the ASB client assembly to be found as well. The assembly can be retrieved from the ASB client package.
2. Installing the counters
Once the contents of the WindowsAzure.ServiceBus.PerformanceCounters package are extracted, have the Microsoft.ServiceBus.dll assembly extracted at the root of the your working directory. The file system would looks as the following:
- |-
Performance - |-
Tracing - |-
Microsoft.ServiceBus.dll - \-
RegisterMessagingPerfCounter.cmd
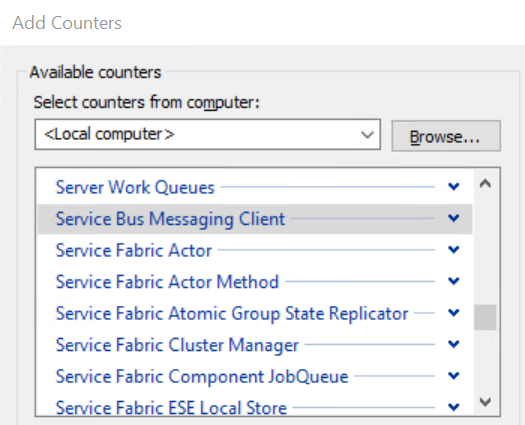
Run RegisterMessagingPerfCounter.cmd in the elevated mode. Once the installation is done, using Performance Monitor add a new counter and navigate to the counter set called Service Bus Messaging Client. This is the set ASB client library adds.
3. Usage the counters
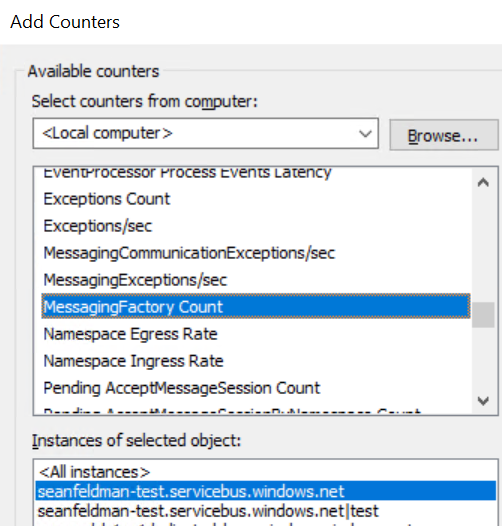
I have an application that might be leaking connections to the broker. A connection is represented by a messaging factory created on the client. MessagingFactory Count counter is what I'll be using to diagnose the issue. Note that it's possible to set the scope of the counter to an entire namespace or a specific entity.
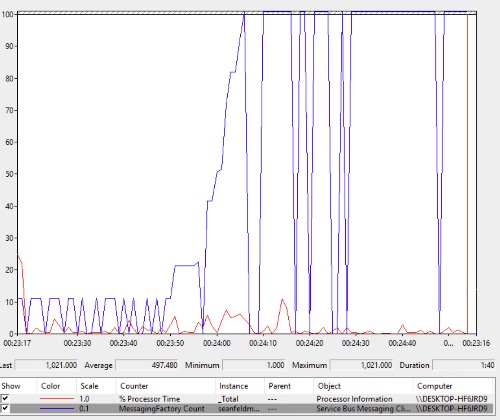
Monitoring the factories counter quickly shows that application is indeed leaking connections (blue graph indicating that there are more than a thousand of connections (scale factor of 0.1 is used).
Equipped with this information, the application is confirmed to be leaking connections by not utilizing the factories properly and causing the problem of exceeding the maximum number of connections ASB broker allows.
And this was only one out of 68 provided counters! Want to know send or recieve message rate success? Ingress or egress rates? Or maybe the failure rate? Dig into those counters and get the information you need. Have fun with ASB perf counters!


