Debugging Pain–End to End
We had an issue recently that caused us some time and quite a lot of head scratching. We had made some relatively minor changes to our product and performed a release into staging for testing. We released our main web application as well as our custom built support tool (also a web app).
After a little bit of testing from our QA team, a few bugs were uncovered. One where a response to a cancel action seemingly was not actioned, and an issue where a timeout occurred on a few requests. Nothing too huge and certainly seemed fixable.
Off to work
The timeouts “seemed” to be data specific and possibly because of our 3rd party web service call being made. It seemed to be only occurring in our support tool, the main web app was not affected. Since the main web app is the priority, I looked at the “cancel” issue not working. It seemed that the cancel request was being made to our server (via an ajax call) but never returning from said call. This looked very similar to our issue with the support tool.
A little further investigation showed that both the support tool and our main web app were issuing ajax requests to a few action methods (we use ASP.Net MVC 4.5) and never returning. Ever. I tried recycling the application pool in IIS. This worked for a brief period, then requests to a few particular requests to action methods were not returning. Web pages from other action methods and even other ajax requests were working fine so at least we knew what surface area we had to look at.
Looking at the requests via Chrome, we could see the request in a constant pending state, never satisfied. We began looking at the server. We instituted some page tracing, looked at event logs and also looked at the Internet Information Server logs. Nothing. Nada. We could see the successful requests come in, but these pending requests were not logged. Fiddler showed they were definitely outgoing, but the web server showed nothing.
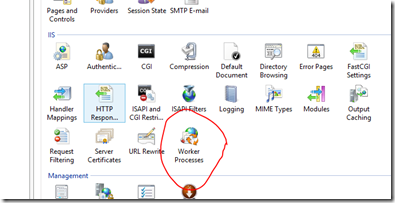
Using the Internet Information Service management console, we looked at the current worker processes which is available when clicking on the root node within the IIS Management console.
We could see our application pool and right clicking on this allowed us to view current requests, and there they were, all waiting to be executed, and waiting…..and waiting.
What’s the hold up?
So what was causing our requests to get backlogged? We tried going into the code and removing calls to external services and trying to isolate the problem areas. All of this was not reproducible locally, nor in any other environment. Eventually trying to isolate the cause led us to removing everything from the controller actions apart from simple Thread.Sleep.While this worked and the problem did not present, we were in no way closer as it was still in potentially any number of code paths.
Take a dump
A colleague suggested using DebugDiag (a free diagnostic tool from Microsoft) to look at memory dumps of the process. So that is what we did.
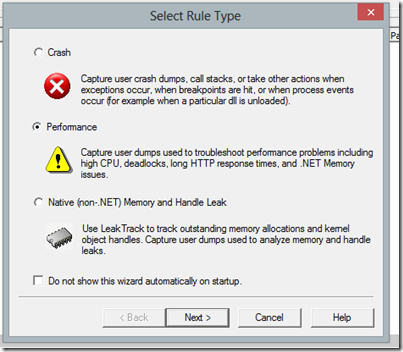
Using DebugDiag, we extracted a memory dump of the process. DebugDiag has some really nice features, one of which is to execute predefined scripts in an attempt to diagnose any issues and present a summary of what was found and also has a nice wizard based set of of steps to get you up and running quickly.
We chose to monitor for performance:
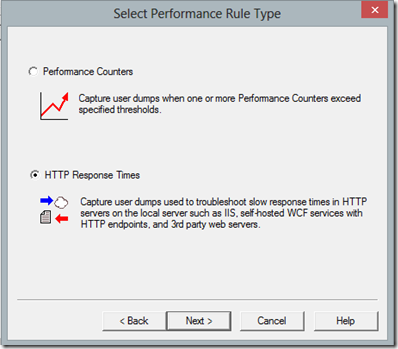
and also for HTTP Response time:
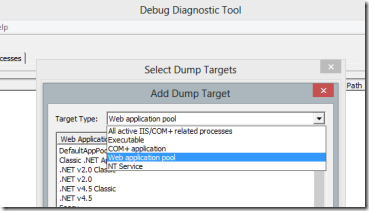
We then added the specific URL’s we were monitoring. We also chose what kind of dumps to take, in this case web application pools:
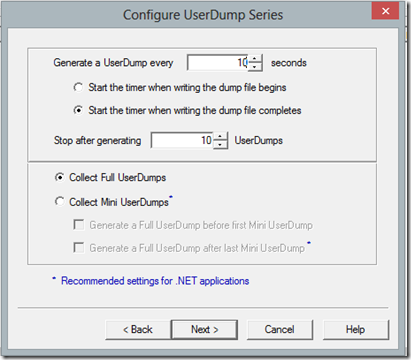
We decided on the time frequency (we chose every 10 seconds) and a maximum of 10 Full dumps:
After that, we set the dump path, named and activated the rule, and we good to go. With the requests already built up in the queue and issuing some more ‘pending’ requests, we could see some memory dumps being taken.
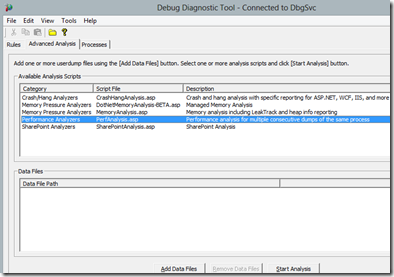
A cool feature of DebugDiag is the prebuilt scripts to analyze your memory dumps (available on the advanced tab):
We initially chose performance, but didn’t glean much information from that. We then chose the “Crash/Hang Analyzers” which produced great summary of all the threads in the pool. It was apparent that almost every thread was waiting on a .Net Lock. We couldn’t get much more than that though.
WinDbg to the rescue
So I copied the memory dump locally and use WinDbg to examine the memory process. I loaded in the SOS extension so I could use the managed memory extensions.
(Side Note: I almost always have issues with incorrect format –32 or 64 bit- and SOS versions when doing this so it usually takes a bit of frigging around before I get the right combination)
I looked at the threads via:
!threads
Sure enough, there were heaps of them in there. Using Dump object (!do) and trying to poke around didn’t reveal too much except a lot of thread locks. So I used the !syncblk command to look at blocked and locking threads:
Here we had some real indication of what was going on. You can see we have 285 locks via the Apache.NMS functions. Our application uses ActiveMQ (which is awesome btw) for our message queuing and we use the Apache.NMS library as the C# interface. In addition, the code paths being executed utilise extensive diagnostic information among all code paths. This diagnostic information is posted to the Message Queue for logging.
A quick test verified this. We commented out all calls to the queue within the queue manager interface (so it effectively did nothing). Put this code on staging and all was working without a hitch.
So we had our culprit, but not the root cause.
We used the admin tool for ActiveMQ to look at the queues themselves.Some queued messages, but not subscribers even though our subscription service was running. Restarted the service, nothing. No subscribers. Using the admin tool we purged all messages. Restarted the service. Nothing. Refreshed the admin tool, the purged messages re-appeared!
We tried deleting the offending queues.Normally, this operation is sub-second. In this case, it took 20+ seconds before we tried again. Something was amiss. We tried creating a new queue from the admin tool.Again, an abnormally long time, but this time it did it. We could then delete queues without issue. Restarted the service and viola, queues subscribed to. We re-instituted the commented code and now all working fine.
So what really happened?
A short time ago, we had run out of space on our staging server. No big deal, freed up the space promptly, all seemingly good. it was during this time that I believe that our message queue repository, which persists messages to disk, got corrupted and this started the issue occurring. What is apparent is that we need to release resources more aggressively so that this issue would not be so detrimental to the rest of the application function.
So there you have it. All in all that took about 2-3 days.
