CosmosDb and Client Performance
Introduction
CosmosDb is the "planet scale" document storage (I love that term) schema-less (NoSQL) system that is offered by Microsoft Azure. It offers guaranteed performance based on how much throughput you select when provisioning it. This is measured using "Request Units" (RU's). It aims to offer virtually unlimited scalability and throughput through the use of partitioned collections spread across a series of high performance storage hardware (SSD's).
This is a pretty lofty claim from Microsoft and like most people, you will want to perform a series of tests or due diligence to ensure you are getting what you expect. Furthermore, provisioning 10,000 request units of throughput doesn't really mean much if you have nothing to compare it to.
With that in mind, this post is specifically about measuring the performance of CosmosDb. However, it is less about the server side engine, and more about the client side.
This post will look at insert performance, and specifically look at the client side settings that can be tweaked to increase performance. This is important as you may be hampered by the client side in terms of performance, instead of the server side. We will target a "single instance" type scenario to keep things consistent, that is, a single instance of a client hosted in various scenarios or environments. This way, we could have throughput metrics for a single unit, which we could then use when scaling out to estimate our overall throughput.
Warning: The post is quite lengthy. If you are in a real hurry or just do not want to read the full post, just skip to the end.
Knowledge pre-requisites
This post assumes you know generally about CosmosDb within Azure. Bonus points if you have used the client library to program against an actual CosmosDb instance and also provisioned a CosmosDb instance. The tests refer to particular options to use within the client library itself.
Performance testing and "feeding the beast"
If you have ever done any degree of performance testing, there are a number of challenges. One of which is getting enough data or simulated load to the test system to ensure it is handling the actual load that you expect and want to measure. If you are load testing a web server and trying to simulate millions of users, or even thousands of users, the client that is simulating those users needs to be able to push that much load to the system. Constraints such as memory, CPU usage and network bandwidth means that the maximum a single client can push to the test system is quite limited. Your server under test may look like it is handling things great, but in reality it is simply not getting the expected load or volume of requests to properly test it from the client, so your results are inaccurate.
With CosmosDb, your application is the client.
In our scenario, we are using CosmosDb to serve the data needs of our application. We wanted to ensure CosmosDb actually did what was advertised, but we also wanted to know what it took to make our application efficient enough to be able to utilise the "planet scale" performance. Furthermore, if our application was limited in its ability to utilise CosmosDb, we could then limit the amount of throughput we have provisioned, therefore reducing our overall cost. CosmosDb is relatively new, and if you have ever used the client library (which is the recommended way, more details here) you will know there are quite a few knobs to turn to tune it, but often it is not clear what kind of performance advantage this offers. This document mentions a range of things you can do but do we implement them all? Which ones are the most effective?
Specifically, we will look at variations when using the following settings:
- Connection Mode: Standard gateway with HTTPS or Direct Mode using TCP
- Variations on number of concurrent tasks and number of operations per task
- Indexing mode used by Cosmos: Consistent or Lazy
- Number of cores, memory and processing power.
- MaxConnections: Started at default.
Settings that remained static:
- Consistency mode: Eventual.
- Partition Key: Guid (this is to achieve a reasonable spread across all physical partitions).
- Client instances. Once a client is created, it is re-used. A client instance is not created per request/operation.
- .OpenAsync() is called on each client prior to any operations being performed. This ensured that the route table was populated prior to any operations and did not affect initial/first operation performance, and thus skew the performance figures slightly.
The scenario
For this scenario, we are going to simulate and measure inserts per second. NoSQL databases are (broadly speaking) better at reads than writes but our scenario called for a high degree of writes. We wanted to know whether both our application and CosmosDb could manage the throughput required, but also what settings provided the best throughput since their seems to be a lot of options to tweak.
Caveats
Usual caveats apply here. This is really a short experiment designed to provide enough information to go on, but is not definitive. This is not quite scientific, but indicative enough to show how different configurations can affect performance when using CosmosDb. The test code is my own (and pretty ugly), and this was tested on my own personal Azure subscription so did not go too high in consumption rates and costs.
Environment setup
- CosmosDb collection: Started initial tests at 10,000 RU's (5 partitions with 2,000 RU's per partition), later changed to 20,000 RU's (4,000 RU's per partition)
- The client code used for the test is located here: https://github.com/glav/CosmosDbClientInsertPerformanceTest
- Note use of parallel task library to achieve concurrency within the client.
- Client code aims to insert 1,000,000 records as quickly as possible.
- Client environments used
- Azure App Service, 2 core instance, 3.5 Gb memory (B2 instance)
- Azure App Service, 4 core instance, 7 Gb memory (B3 instance)
- Azure Virtual Machine, Basic, A4, 8 Core, 14Gb memory, HDD
- Azure Virtual Machine - Standard, D8s V3, 8 Core, 32Gb memory, SSD
- Document that will be inserted is relatively simple and small:
{
"KeyNumber": 1,
"SomeText": "blah blah",
"SomeCount": 100,
"PartitionKey": "09df03d7-ceb6-482d-a979-3db0b3dc2398"
}
and is represented by this class
public class PerfTestDto
{
public int KeyNumber { get; set; }
public string SomeText { get; set; }
public int SomeCount { get; set; }
public string PartitionKey => Guid.NewGuid().ToString();
}
Note that the PartitionKey is a Guid.
Test results
Listed here are the individual tests and the results of those tests. It is quite lengthy so if you are only interested in the outcome or findings, you may want to skip this section and head straight to the findings at the bottom. Note that only changes to each environment and tests are listed in the test results to reduce excessive text. So if the previous test lists a connection mode of direct and the next test doesn't change that setting, it will not be listed with the test details. In addition, metric snapshots will be listed where I believe it may be "interesting" and not on all tests. Finally, I have included some commentary on each test to try and highlight what I saw happening.
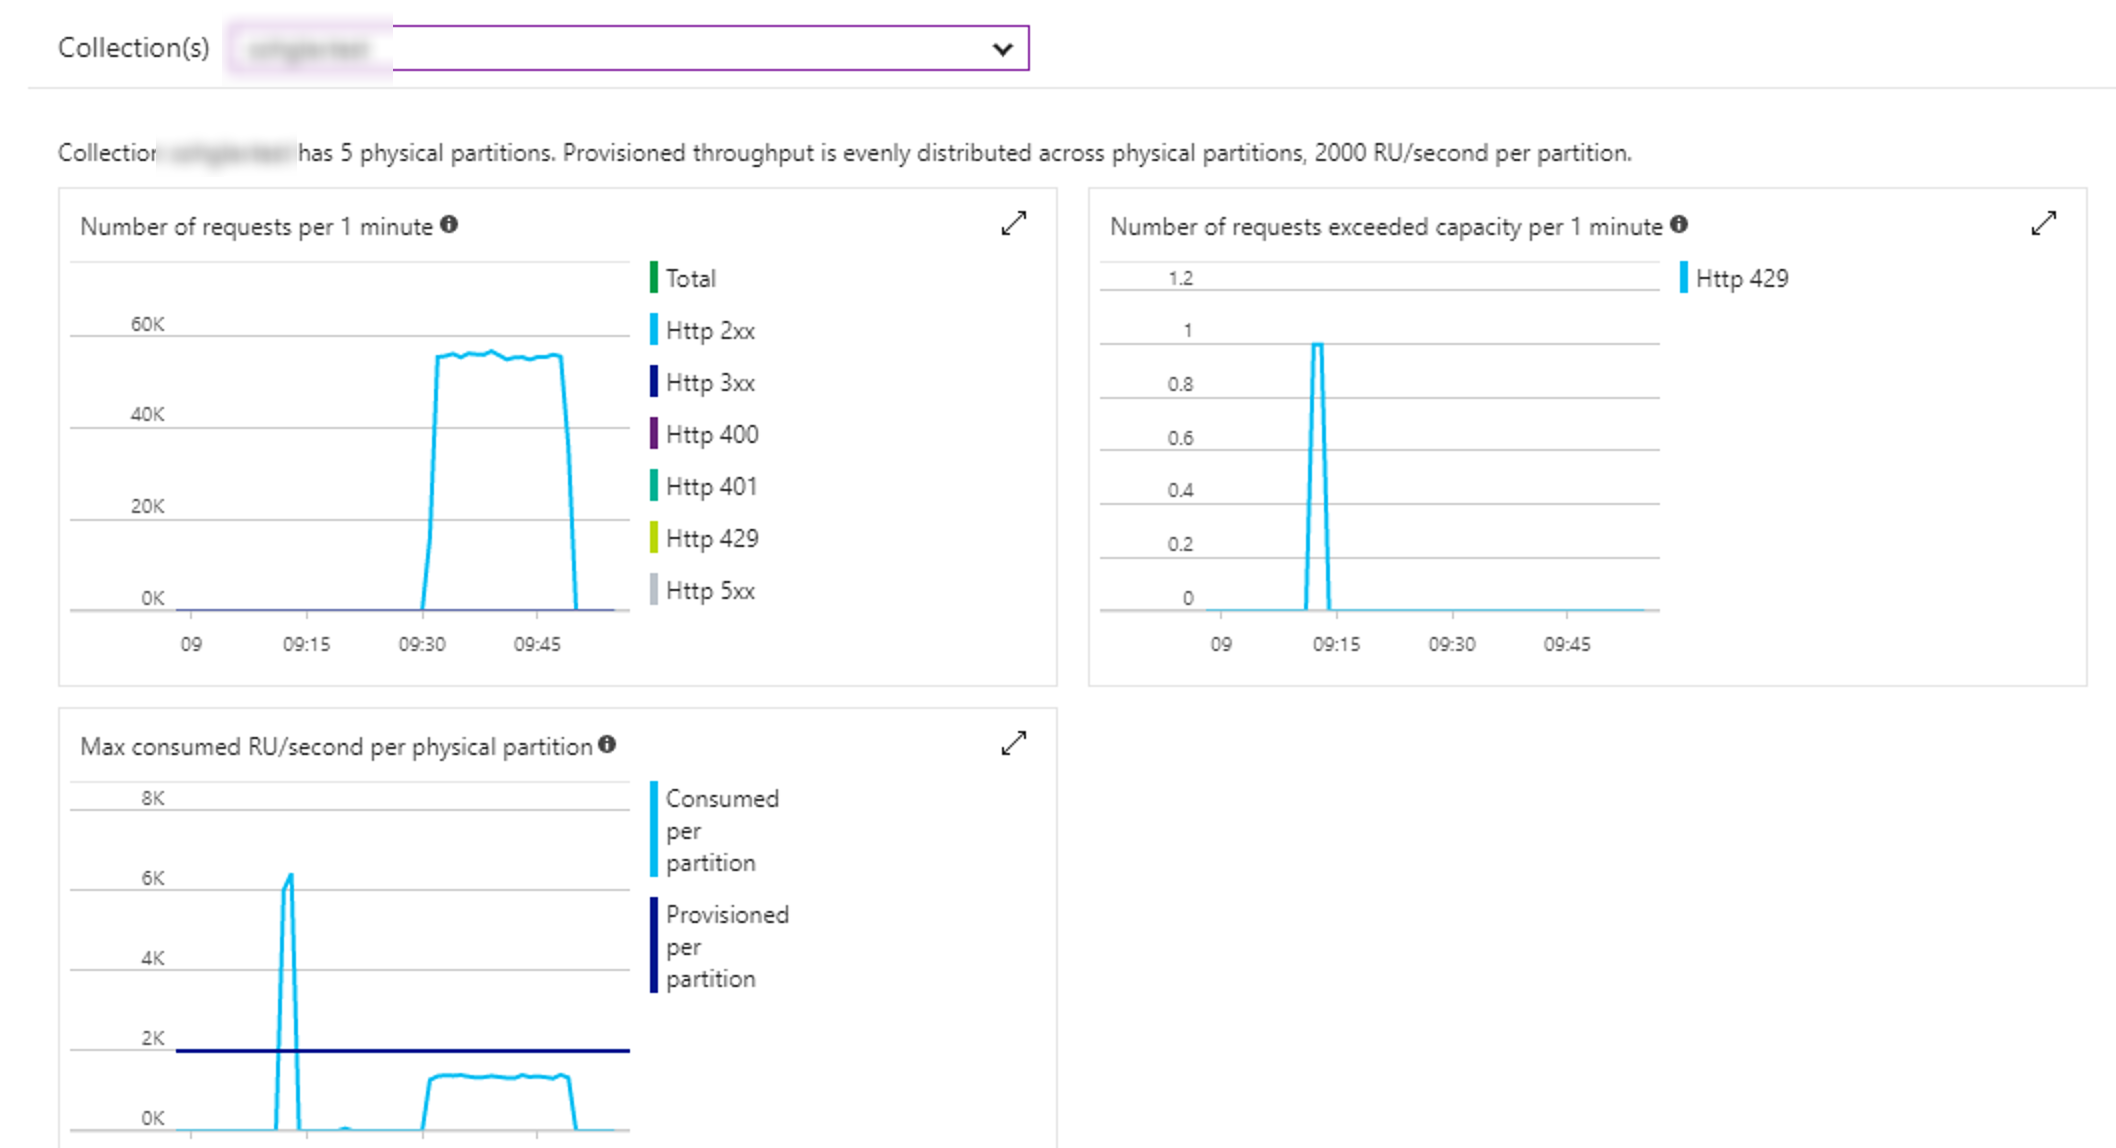
Test 1
- Environment: Azure App Service, 2 core instance, 3.5 Gb memory (B2 instance)
- CosmosDb: 10,000 RU/s, 5 partitions, 2,000 RU/s per partition
- Indexing mode: Consistent
- Connection Mode: Standard - HTTPS
- Client: 10 concurrent tasks, inserting 100,000 records each.
- Time elapsed: 0:27:40.277
- Throughput: 602 inserts per second.
- Comments: This test is going to act as my baseline.
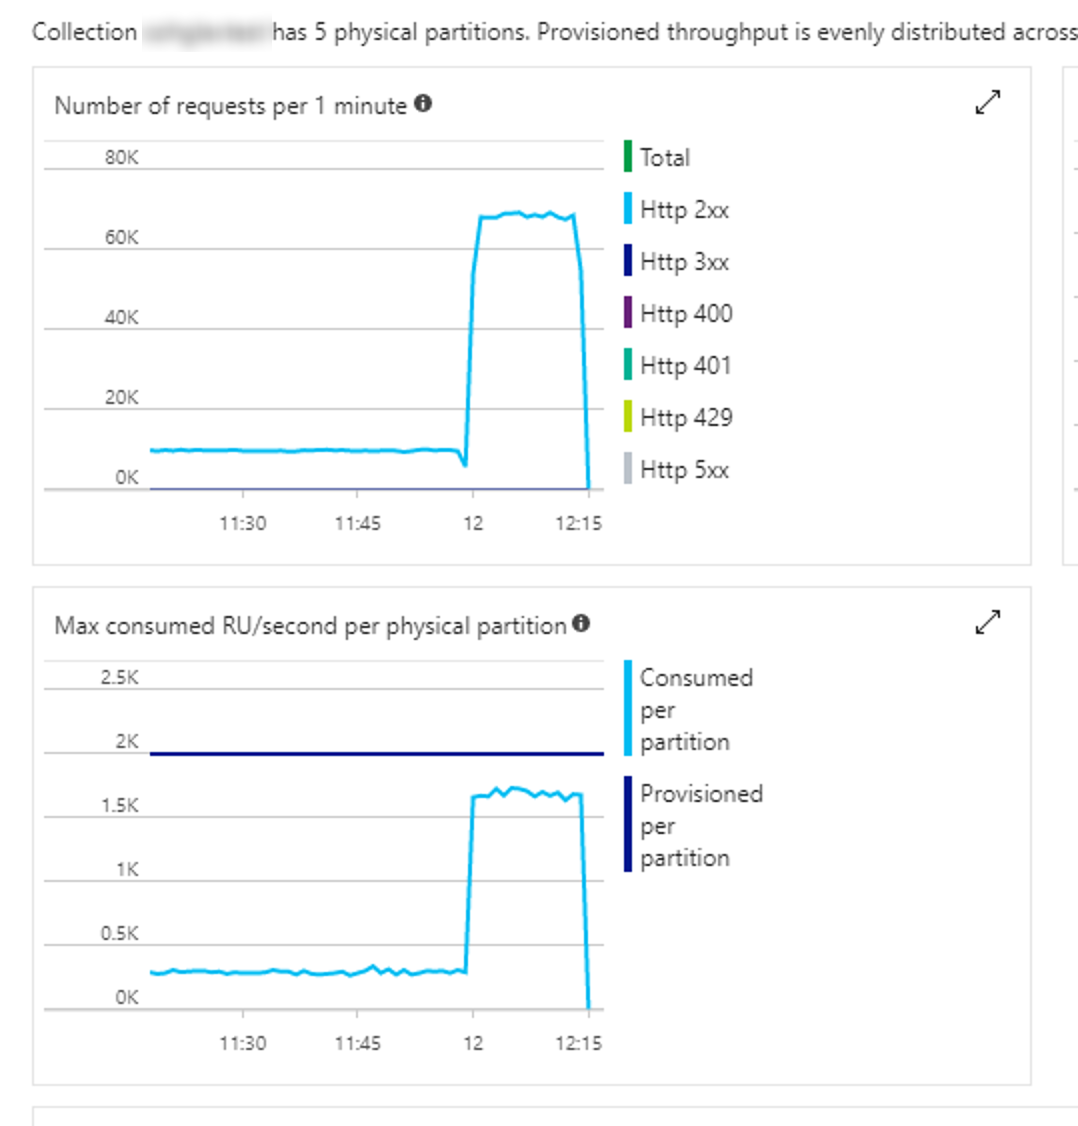
Test 2
- Connection Mode: Direct gateway mode, connection TCP
- Time elapsed: 0:17:57.701
- Throughput: 927 inserts per second.
- Comments: Pretty big improvement just by changing the connection mode. Not surprising though.
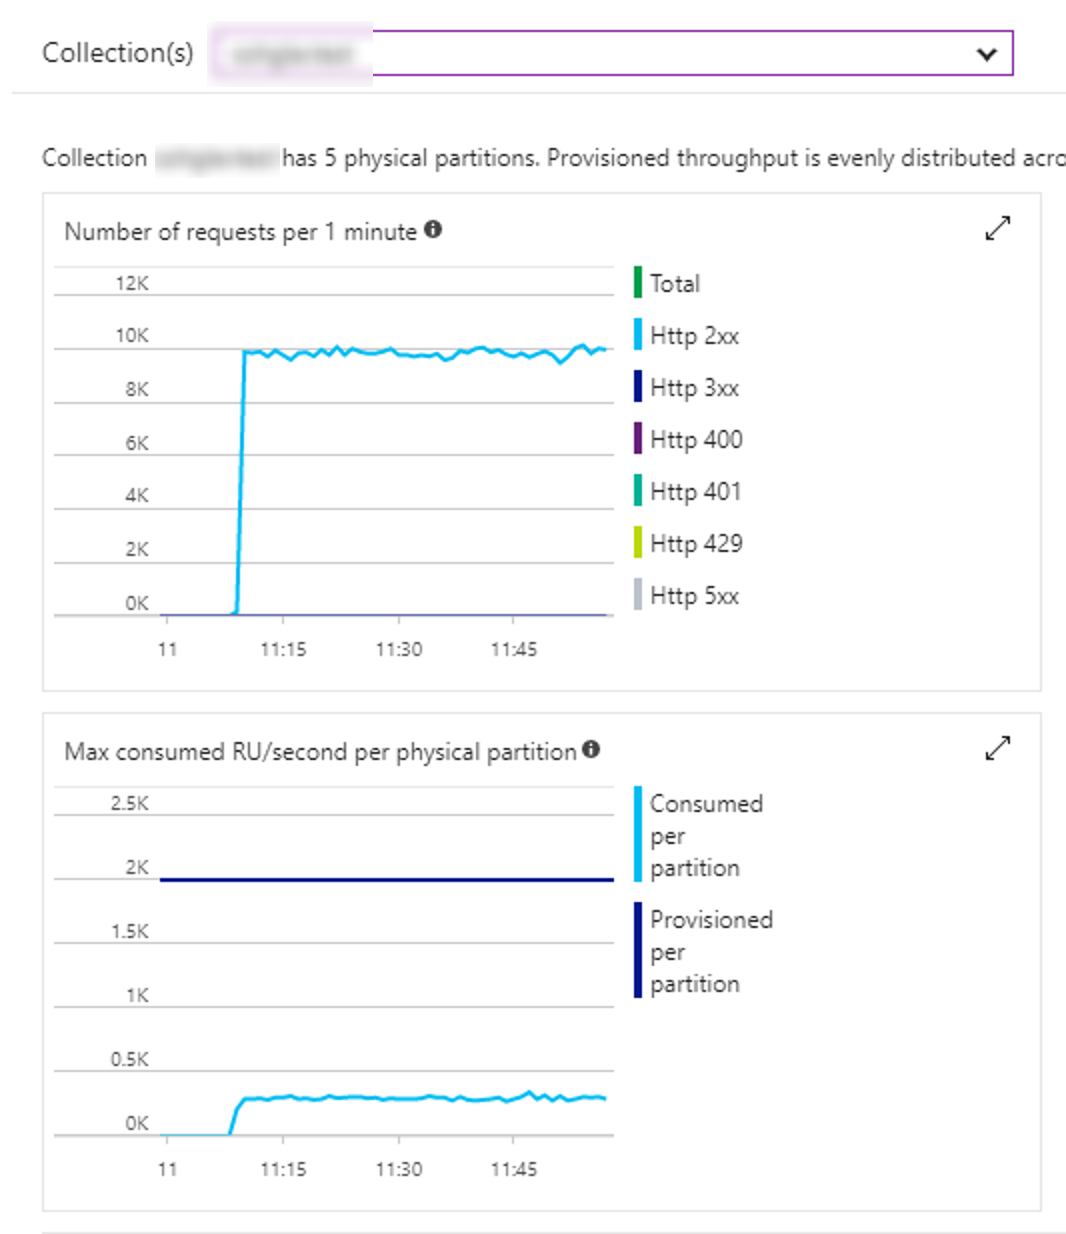
Test 3
- Client: 1 task inserting 1,000,000 records sequentially
- Time taken: 42 minutes before being manually cancelled.
- Comments: Probably should have done this first but it wasn't a realistic scenario for me, however I did want to see the effect of no parallelism. As you can see, it took a long time and I got bored. Conclusion, performance sucked.
Test 4
- Client: 20 tasks, inserting 50,000 records each.
- Time taken: 0:14:38.209
- Throughput: 1,138 inserts per second.
- Comments: Increasing the number of concurrent tasks helped here (from 10 to 20, inserting less records each).
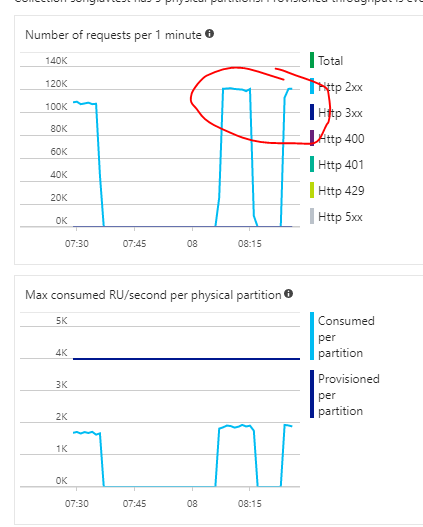
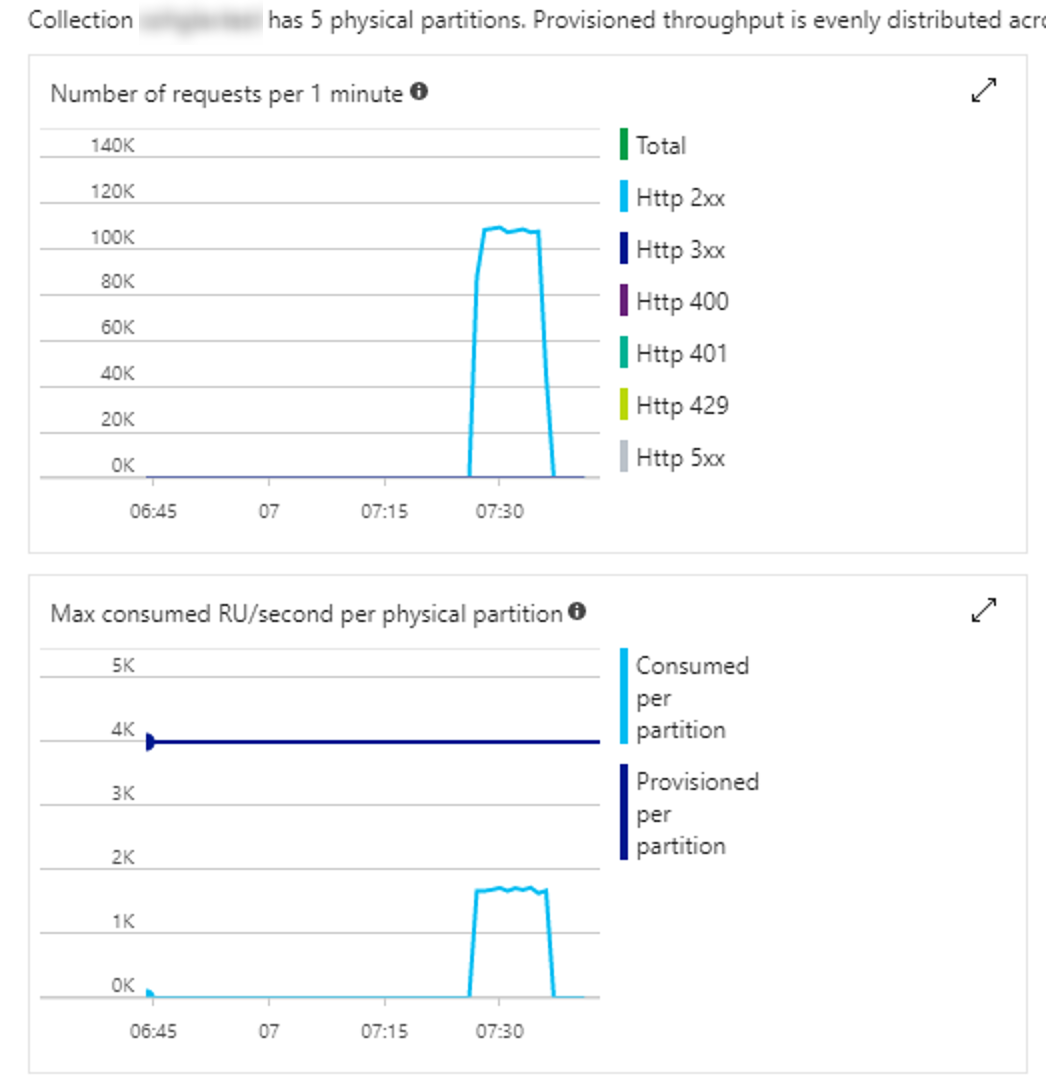
Test 5
- Client: 40 tasks inserting 25,000 records per task
- Time taken: 0:14:50.564
- Throughput: 1,122 inserts per second.
- Approximately same portal metric profile as Test #4
- Comments: No real improvement so we are clearly hitting a bottleneck or peak for this configuration.
Test 6
- Client: 20 tasks inserting 50,000 records per task
- MaxConnections: 1000 (previously left at default).
- Time taken: 0:14:39.581
- Approximately same portal metric profile as Test #5 and #4
- Comments: No real discernible change here, or at least none of note by changing MaxConnections.
Test 7
- Indexing mode: Lazy
- Time taken: 0:14:31.130
- Throughput: 1,147 inserts per second.
- Comments: I had thought relaxing the indexing mode may help. It did marginally but not by much and would require further experimentation on this setting alone.
Test 8
- Consistency mode: Eventual (default is Session)
- Time taken: 0:14:44.665
- Throughput: 1130 inserts per second
- Comments: Not much change here, a little less but nothing of note.
Test 9
- CosmosDb: Increased to 20,000 RU/s, 5 partitions, 4,000 RU/s per partition
- Environment: Azure App Service, 4 core instance, 7 Gb memory (B3 instance)
- Time taken: 0:9:13.807
- Throughput: 1805 inserts per second
- Comments: I increased the throughput/RU per second in anticipation of more throughput. As expected, increasing the Azure app service instance to a 4 core machine helped to increase throughput.
Test 10
- Client: 40 tasks inserting 25,000 records per instance
- Time taken: 0:9:47.259
- Throughput: 1703 inserts per second
- Comments: Trying to play with an optimal parallelism setting by increasing to 40 tasks (from 20) with less to insert. Bit of a drop so probably hitting the next peak/ceiling. At this point, it is looking like more cores and processing ability are the key.
Test 11
- Environment: Virtual Machine, Basic, A4, 8 Core, 14Gb memory, HDD
- Client: 20 tasks, inserting 50,000 records per task
- Time taken: 0:8:20.205
- Throughput: 1998 inserts per second
- Comments: Decided on using an actual virtual machine where I can really play with core/processing power settings. As somewhat expected, increasing to an 8 core VM (albeit basic) helped to improve throughput.
Test 12
- Client: 40 tasks inserting 25,000 records per task
- Time taken: 0:8:13.253
- Throughput: 2027 inserts per second
- Comments: Increasing parallelism with the added processing power and cores seemed to increase our peak/ceiling so throughput increased again.
Test 13
- Client: 100 tasks, all inserting 10,000 records per instance
- Time taken: 0:8:41:34
- Throughput: 1919 inserts per second.
- Comments: Increasing number of tasks by a large margin here. As you can see, a drop in throughout so hitting another peak.
Test 14
- Client: 50 tasks, all inserting 20,000 records per instance
- Time taken: 0:8:5.46
- Throughput: 2060 inserts per second
- Comments: Dropping to 50 tasks instead of 100, but more than the 40 of Test #12 increased throughout again to our highest thus far. For this VM configuration, this is looking like the sweet spot.
Test 15
- Client: 60 tasks inserting 16,667 records per task
- Time taken: 0:8:11.968
- Throughput: 2031 inserts per second
- Comments: Increasing parallelism a little actually drops throughput, confirming previous thoughts that 50 tasks (as in Test #14) is the sweet spot for this configuration.
Test 16
- Environment: Virtual Machine, Standard, D8s V3, 8 Core, 32Gb memory, SSD, Note: Enabled low latency networking on creation
- Client: 60 tasks inserting 16,667 records per task (same as prior)
- Time taken: 0:3:38.224
- Throughput: 4245 inserts per second
- Comments: Boom. Increasing the VM to a D8s V3 with low latency networking massively increased throughput for the same level of parallelism.
Test 17
- Client: 100 tasks inserting 10000 records per task
- Time taken: 0:3:35.527
- Throughput: 4256 inserts per second
- Comments: Trying to bump up parallelism again yielded some benefits and the highest throughput to date, but is probably a little high. However, this is enough evidence for this short experiment.
Findings
Based on the not so scientific, nor comprehensive tests (but enough for me), these are the findings:
- Connection Mode: This has a significant impact on throughput and Direct Gateway Mode using TCP should be used where possible.
- Parallelising write (or read) actions. For a single client, parallelising the operations as much as the environment will allow before hitting a peak has significant impact on throughout. Finding that peak will depend on environment configuration and mostly relates to processing power and multiple cores.
- Scaling out operations: This would also achieve the same effect here so instead of multiple cores, you would also use multiple instances. This is where I think CosmosDb really starts to show its performance.
- More cores: The more cores, and the more powerful the cores has significant impact on throughout. In combination Low latency networking would also help a lot here.
- Indexing mode had minimal effect. It may have helped a bit but the percentage increase in this scenario was negligible. More testing on this specifically to determine full effect is required.
- Consistency mode: I had thought this would have had a greater impact but it was only minimal. That is not to say it doesn't, but when balancing performance and consistency, lowering the consistency setting does not have that much performance benefit. Again, more testing against all consistency levels is required to better determine the range this setting has.
- MaxConnections: This seemed to have little to no effect. This may be more applicable to Standard gateway mode with HTTPS but going with Direct mode TCP had such a significant improvement, it did not seem to matter.
Conclusion
More power, scale out/parallelise and connection mode. These are the key take-aways here from a client perspective and getting the most from CosmosDb. I'd like to have time and Azure credits available to perform much more granular testing but I found out what I needed to know.
I hope this has been helpful and save you some time. I'd love to know your experience or thoughts around this.