Simple, fast and useful MiniProfiler for ASP.NET MVC
MiniProfiler is very lightweight, simple, fast and useful profiler for ASP.NET websites including ASP.NET MVC. It is designed to help you find possible performance issues and have very nice and clear view over each operation that happens in your web applications.
MiniProfiler was created by the Stack Overflow guys for their internal use, but they have put it as an open source project under Apache License 2.0 for all ASP.NET and WCF developers! (Thanks guys!)
To get started using MiniProfiler, you have to install it first.
You have two options available:
Installation
1. Using NuGet Package Manager
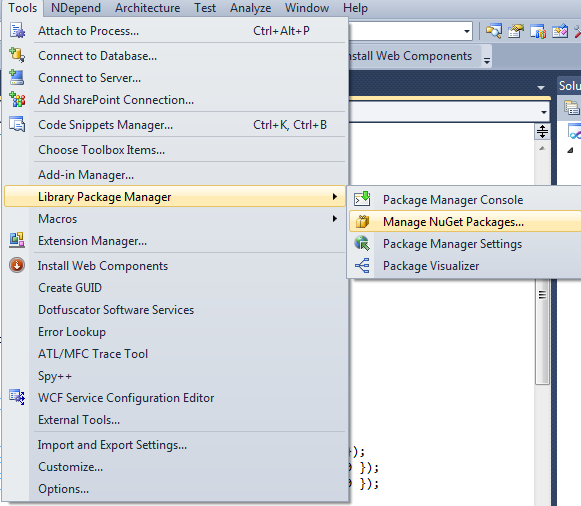
- In VS.NET 2010, go to Tools –> Library Package Manager –> Manage NuGet Packages…
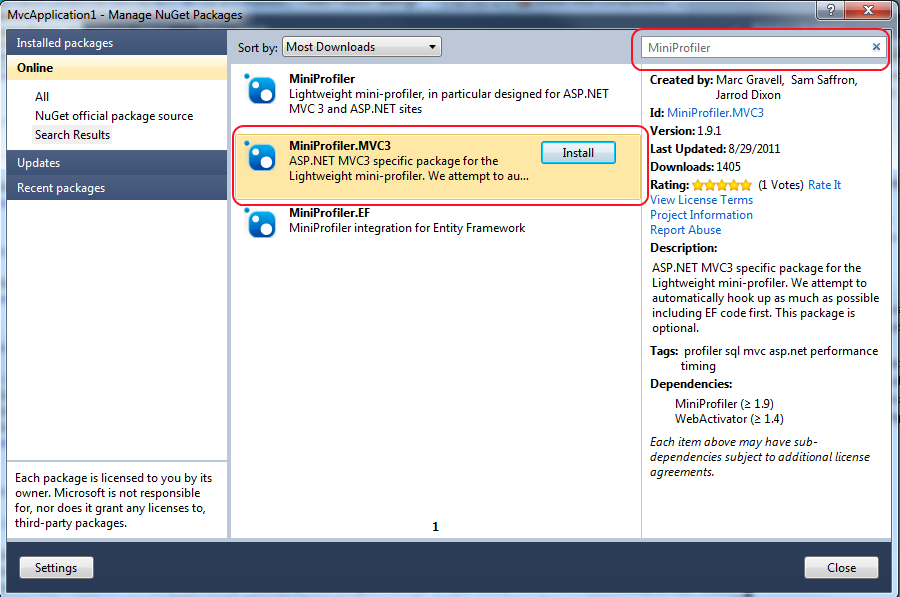
Install MiniProfiler.MVC3
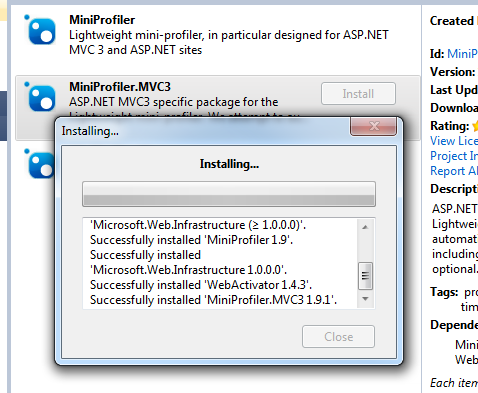
Once installation is successful, both MiniProfiler will be ticked.
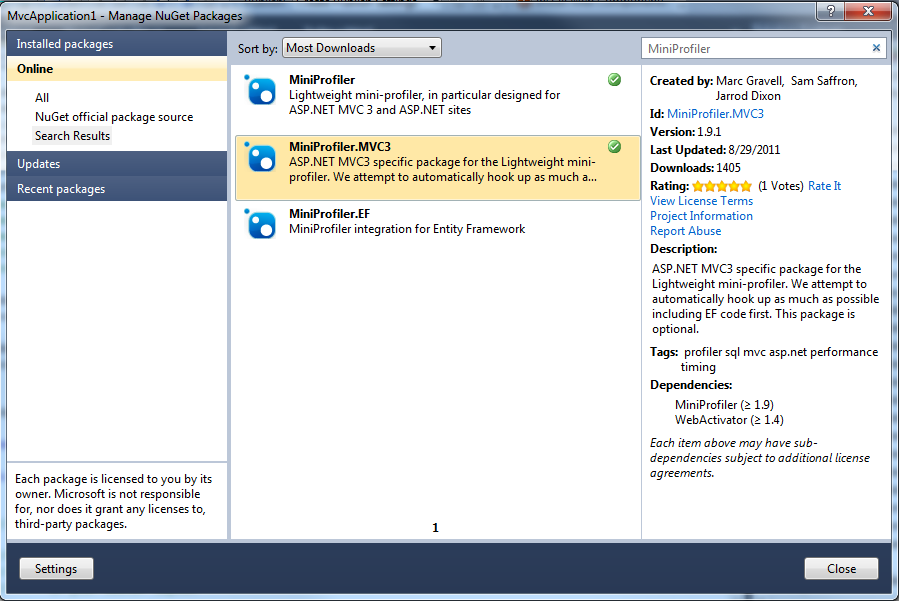
If you want to use MiniProfiler for Entity Framework too, then install the MiniProfiler.EF too.
2. Install manually from here (you have github clone too)
Setting up
Once you are done with installation, if you have used NuGet manager to install MiniProfiler, you are almost done
The new dlls added by the NuGet are marked:
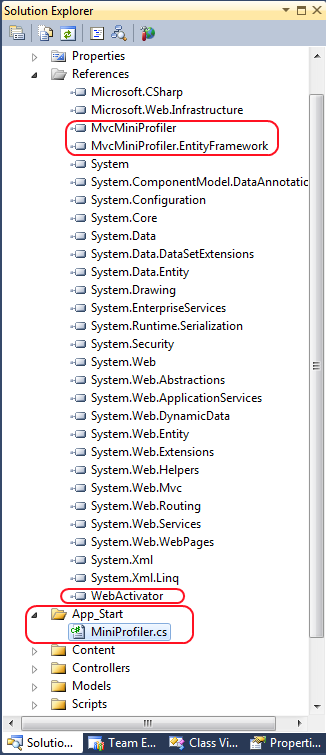
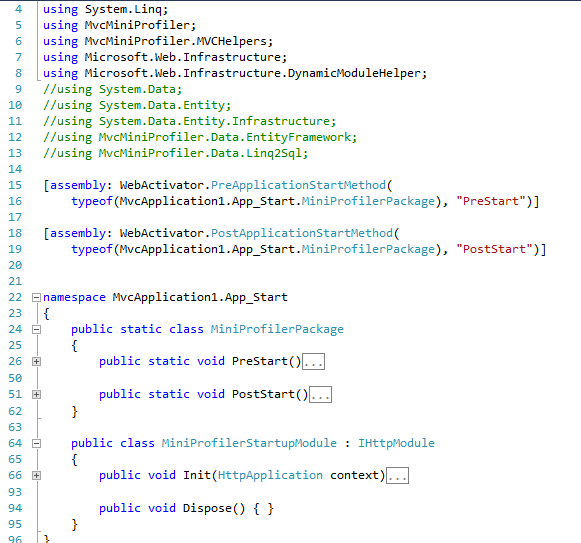
Besides dlls, there is also a MiniProfiler.cs class inside App_Start folder
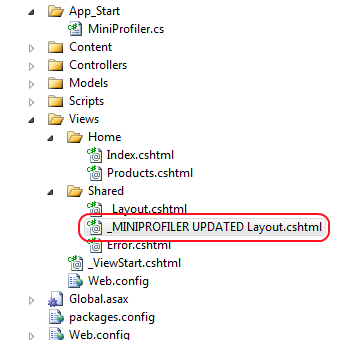
The next thing you need to do is to include MiniProfiler in the master layout page. Once you expand the Views –> Shared, you can see that with installing MiniProfiler there is _MINIPROFILER UPDATED Layout.cshtml that is an example master layout regarding how to include MiniProfiler in your Layout page.
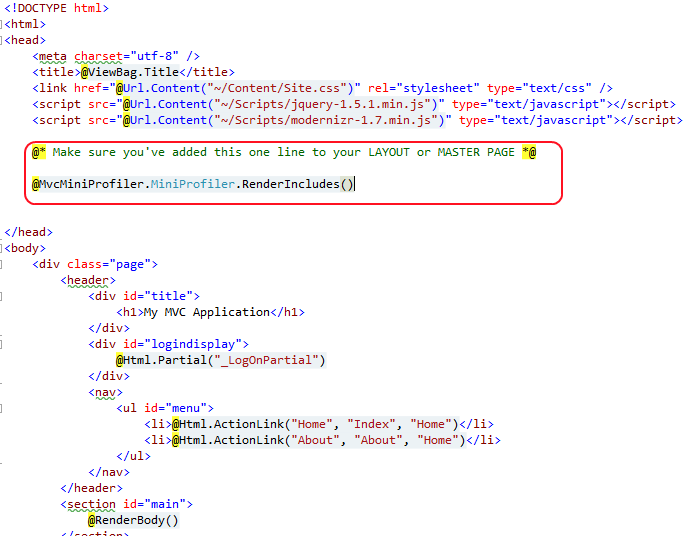
Copy the marked line and add it to your actual _Layout.cshtml
In my example:
<!DOCTYPE html>
<html>
<head>
    <title>@ViewBag.Title</title>
    <link href="@Url.Content("~/Content/Site.css")" rel="stylesheet" type="text/css" />
    <script src="@Url.Content("~/Scripts/jquery-1.4.4.min.js")" type="text/javascript"></script>
    @MvcMiniProfiler.MiniProfiler.RenderIncludes()
</head>

<body>
    @RenderBody()
</body>
</html>
Using MiniProfiler
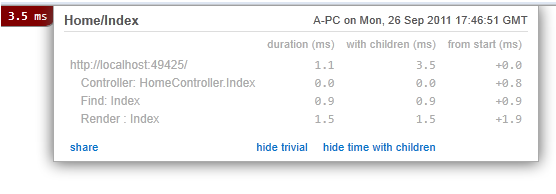
Now, run your application… you can see MiniProfiler is running in the top left corner:

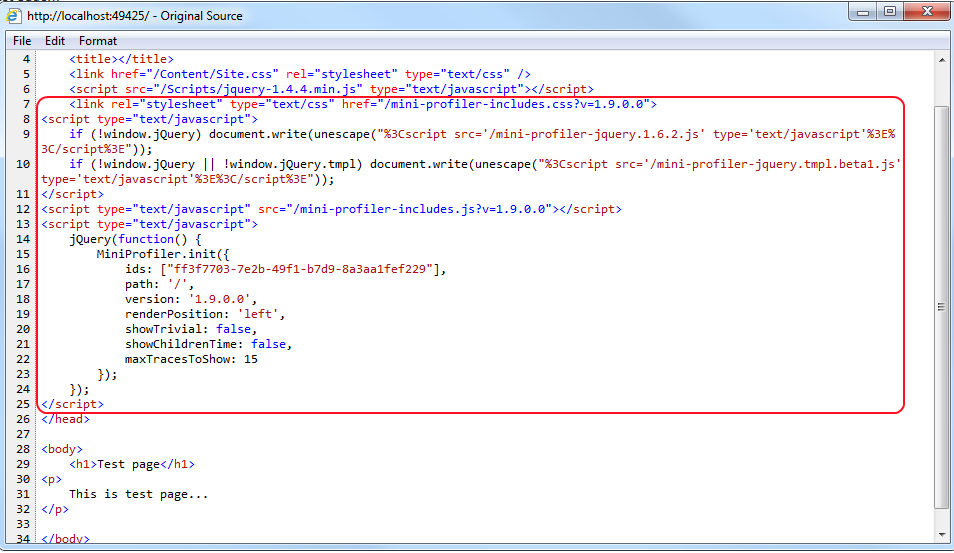
If you want to see what does MiniProfiler includes for us, check View Source in your browser:
If you want to start the mini profiler for specific requests only (e.g. local requests), you can use MiniProfiler.Start() method. The best place to add this is in the Global.asax Application_BeginRequest.
Grouping Profiler Steps
Using MiniProfiler we can group profiling steps very easily. Yep, this might make your code in some segments a bit more dirty, but if you have clean code you should no worry…
To perform grouping by steps in your Controller, first add using MvcMiniprofiler; directive
using MvcMiniProfiler;
Create instance of MiniProfiler by adding the MiniProfiler.Current that represents the currently running profiler in the HttpContext
Use the Step() method in using code block to create profiler step.
Example:
Then in my Products ActionResult add the following code:
public ActionResult Products()
{
    List<Product> listProducts = new List<Product>();

    MiniProfiler profiler = MiniProfiler.Current;

    using (profiler.Step("Load Product Items", ProfileLevel.Info))
    {
        System.Threading.Thread.Sleep(1000); //1 second sleep
        listProducts.Add(new Product() { ProductID = 1, Name = "Product 1", Price = 100 });
        listProducts.Add(new Product() { ProductID = 2, Name = "Product 2", Price = 200 });
        listProducts.Add(new Product() { ProductID = 2, Name = "Product 3", Price = 300 });            }

    using (profiler.Step("Add Products to List", ProfileLevel.Info))
    {
        System.Threading.Thread.Sleep(2000); //2 seconds sleep
        ViewBag.Products = listProducts;
    }

    return View();
}
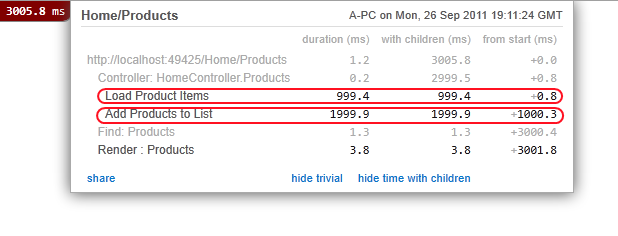
In this example we have two profiler steps: Load Product Items and Add Products to List.
Now add new View to display products list by right clicking somewhere above the code in Products() method and Add View with name Products.
In the view add the following code (just for the demo…):
@{
    ViewBag.Title = "Products";
    Layout = "~/Views/Shared/_Layout.cshtml";
}

<h2>Products</h2>
<p>
    <ul>
        @foreach (var item in ViewBag.Products)
        {
            <li>
                @item.Name ($@item.Price)
            </li>
        }
    </ul>
</p>
Now run the web page and navigate to /Home/Products

once you click the button at the top-left corner you will get this:
Profiling Database Queries
To use MiniProfiler for profiling database queries, first you will need to de-comment one (or both) of the database related line/s inside App_Start/MiniProfiler.cs PreStart() method
//TODO: To profile a standard DbConnection:
// var profiled = new ProfiledDbConnection(cnn, MiniProfiler.Current);

//TODO: If you are profiling EF code first try:
 MiniProfilerEF.Initialize();
In our example I will be using the EF Mini Profiler.
First, I have rewritten the Products method with the following code:
public ActionResult Products()
{
    AdventureWorksEntities context = new AdventureWorksEntities();

    ViewBag.Products = (from p in context.Products
                        join pm in context.ProductModels on p.ProductModelID equals pm.ProductModelID
                        join pmx in context.ProductModelProductDescriptionCultures on pm.ProductModelID equals pmx.ProductModelID
                        join pd in context.ProductDescriptions on pmx.ProductDescriptionID equals pd.ProductDescriptionID
                        select new ProductViewModel
                        {
                            ProductID = p.ProductID,
                            Name = p.Name,
                            Description = pd.Description.Substring(0, 200)
                        });

    return View();
}
I am using AdventureWorks database with EF. I have added one query that joins four tables. Now just run the application.
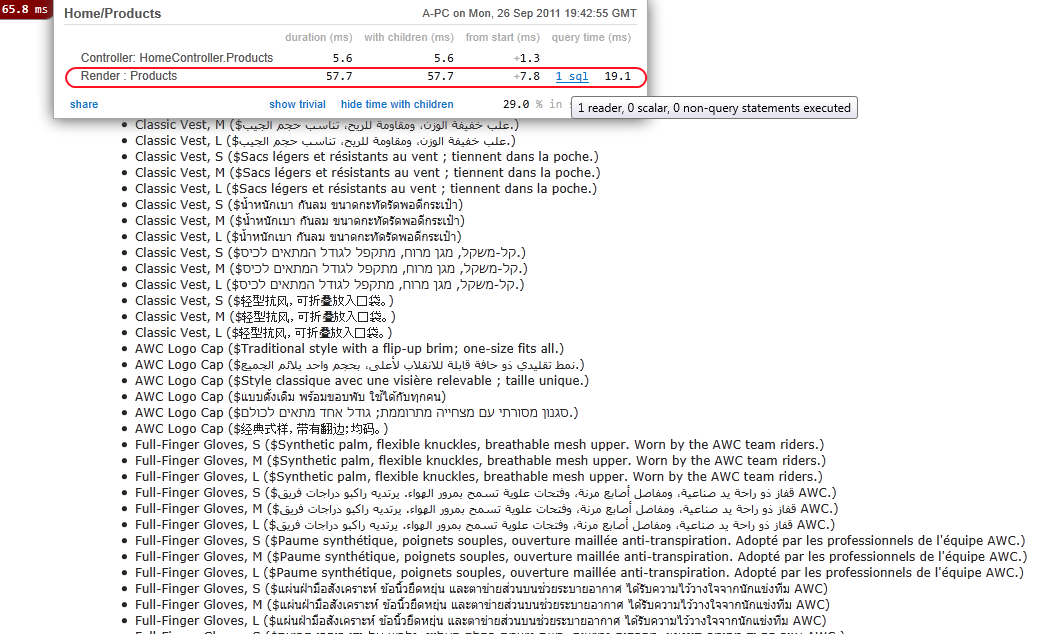
if we click on 1 sql, the MiniProfiler will give us some detailed info regarding generated SQL query and the time needed to execute and finish

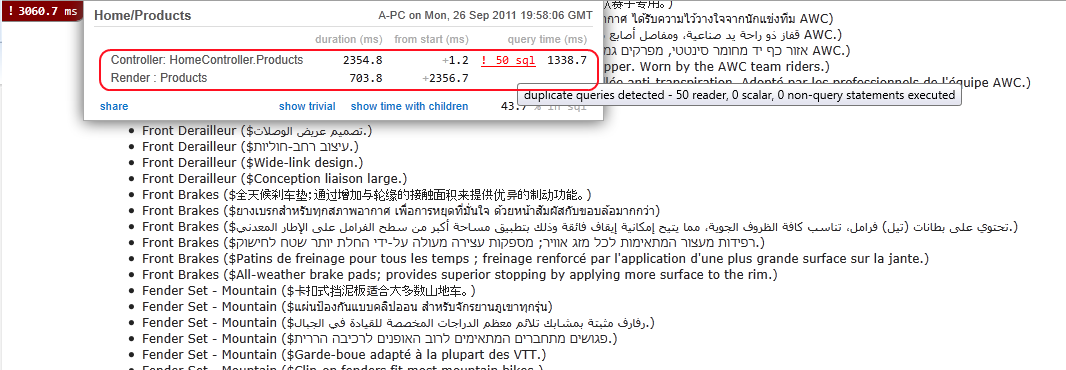
If we have some query that is executing very long or we have multiple queries which create performance issues, MiniProfiler will give us warnings…
For example, lets add loop of executing the above query 50 times
public ActionResult Products()
{
    AdventureWorksEntities context = new AdventureWorksEntities();

    List<ProductViewModel> productList = new List<ProductViewModel>();

    for (int i = 0; i < 50; i++)
    {
        productList.AddRange(from p in context.Products
                       join pm in context.ProductModels on p.ProductModelID equals pm.ProductModelID
                       join pmx in context.ProductModelProductDescriptionCultures on pm.ProductModelID equals pmx.ProductModelID
                       join pd in context.ProductDescriptions on pmx.ProductDescriptionID equals pd.ProductDescriptionID
                       orderby p.Name descending, p.ProductID ascending, pd.Description descending, pd.ModifiedDate descending
                       select new ProductViewModel
                       {
                           ProductID = p.ProductID,
                           Name = p.Name,
                           Description = pd.Description.Substring(0, 200)
                       });
    }

    ViewBag.Products = productList;

    return View();
}
Once we run the app, it will take few seconds to load…
Summary
ASP.NET MVC MiniProfiler is a great tool that you must have in your toolset for building scalable, fast and performance optimized web applications. You can have clear view of what is causing performance issues in your application in almost all levels and layers.
For those that are interested to get access to the MiniProfiler source code and want to dig more, check this page.
I hope this was useful blog post for you.
Regards,
Hajan
Similar readings