AjaxView – Javascript profiling
A little while ago, I posted about a tool called AjaxView to allow you to profile javascript code within your web applications.
Well, I was contacted by Adam who is working on this tool about its latest incarnation. It appears had a lot of work done to it, and now looks quite slick and is really nice to use. Previously, it was quite raw in use and also with the metrics its provides. Now, it acts very similar to one of my favourite profilers, Ants Profiler.
What does it do?
This tool injects profiling code into your javascript that enables it to analyse your javascript code and provide accurate metrics around all the operations being performed, including anonymous functions. It then provides these metrics to the Visual Studio performance tools for you to view in a very simple and familiar manner.
How do you use it?
You need to be using IIS7 in Integrated mode for this tool to work. A full set of install instructions is listed here along with the installation files. It installs pretty easily.
What do you get?
In short, you get detailed metrics on each page and javascript file in your site. When access a site with the AjaxView profile tools installed, all metric information is automatically being recorded. You can then access a web site on your local machine that is installed when AjaxView is installed. (Something like http://localhost/AjaxView).
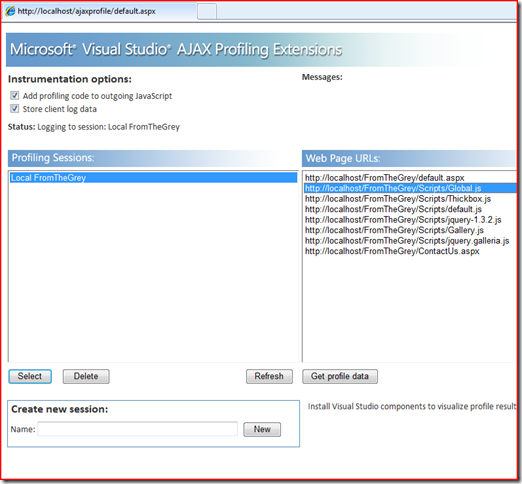
When you do that, you can view the session profiles you have created (or the default one that is created for you on install). Something like this:
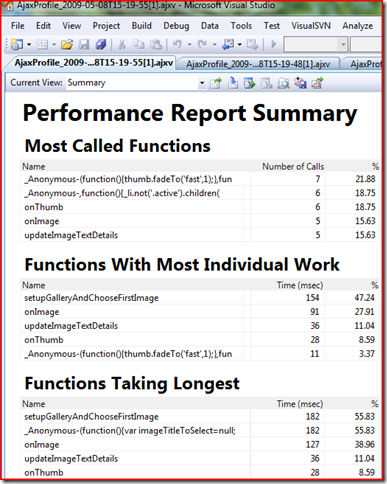
Select any of the files on the right which constitute all the files access by your web app (either a page or javascript file). Select the ‘Get profile data’ button and it launches Visual Studio and provides the profile metric data so that you can view it within Visual Studio. You end up getting access to detailed multiple views like the ones shown below:
All in all, a pretty useful tool to look at your Javascript performance. I recommend you take a look. Get it from here.


