How to Make a Heat Map Chart - VB.NET Telerik RadChart Heatmap Project Using Gantt in Code Behind
This project uses VB.NET, 3.5 Framework, and was created using Visual Studio 2008. If you do not own Telerik, please download and install the Telerik free trial.
In this VB.NET project, I use RadChart to create a 3x3 Heatmap using the Gantt Chart in code-behind. HeatMapVBNannetteThacker.zip. Please also see the C# version of this post.
Open the project within the Heatmap/Heatmap directory. Source code is in the Heatmap/HeatmapWebsite directory.
This project demonstrates how to add a user control to a web page. See the default.aspx page.
<%@ Page Language="VB" AutoEventWireup="false" CodeFile="Default.aspx.vb" Inherits="_Default" %> <%@ Register Assembly="Telerik.Web.UI" Namespace="Telerik.Web.UI" TagPrefix="telerik" %> <%@ Register TagPrefix="uc" TagName="HeatMapChart" src="~/HeatMap/HeatMapChart.ascx" mce_src="~/HeatMap/HeatMapChart.ascx" %> <!DOCTYPE html PUBLIC "-//W3C//DTD XHTML 1.0 Transitional//EN" "http://www.w3.org/TR/xhtml1/DTD/xhtml1-transitional.dtd"> <html xmlns="http://www.w3.org/1999/xhtml"> <head runat="server"> <title>Residual Risk Heat Map</title> </head> <body> <form id="form1" runat="server"> <telerik:RadScriptManager ID="RadScriptManager1" runat="server"> </telerik:RadScriptManager> <div> <asp:Label ID="lblError" runat="server"></asp:Label> <uc:HeatMapChart ID="HeatMapChart" runat="server" /> </div> </form> </body> </html>
The calling page passes in the riskimpact and the risklikelihood. Normally these values would be retrieved from your database.
' retrieve these values from a database and pass in. For now we'll hard-code them. Dim RiskLikelihood As Integer = 3 Dim RiskImpact As Integer = 2 HeatMapChart.LoadChart(RiskImpact, RiskLikelihood)
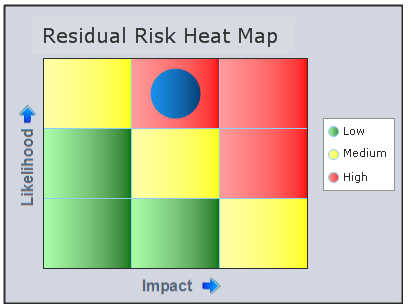
The Heatmapchart.ascx user control is found in the /Heatmapwebsite/Heatmap directory. In the user control, I use RadChart to display a heat map. In a 3x3 Heat Map Chart a bullet displays in the corresponding area of the chart.
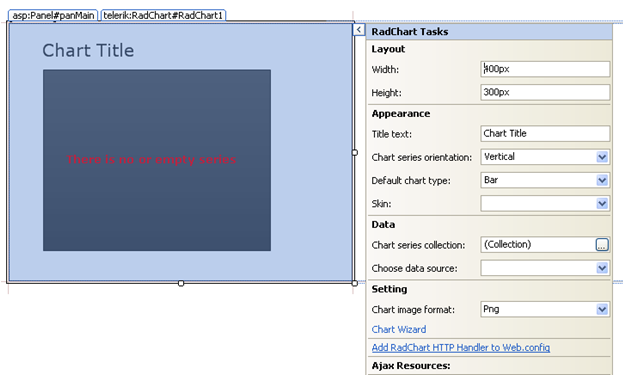
The code-in-front simply stubs in the RadChart, our coding is in the code behind:
<%@ Control Language="VB" AutoEventWireup="false" CodeFile="HeatMapChart.ascx.vb" Inherits="HeatMapChart" %> <%@ Register Assembly="Telerik.Web.UI" Namespace="Telerik.Web.UI" TagPrefix="telerik" %> <asp:Label ID="lblError" runat="server"></asp:Label> <asp:Panel ID="panMain" runat="server"> <telerik:RadChart ID="chtHeatMap" runat="server"> </telerik:RadChart> </asp:Panel>Once you've added the RadChart, you can go to Design mode, select the tab on the right of the RadChart and select to "Add RadChart HTTP Handler to Web.config."
The appropriate references will be added to the web.config file:
<add name="ChartImage_axd" verb="*" preCondition="integratedMode" path="ChartImage.axd" type="Telerik.Web.UI.ChartHttpHandler" />
In our code behind, we need to import Telerik.Charting:
Option Strict On Option Explicit On Imports Telerik.Charting
The RadChart is setup in the LoadChart function. This example shows how to use the Image FillType for the background labels.
This project demonstrates how to setup three ChartSeries; setup the PlotArea XAxis and YAxis, and add a ChartSeriesType.Bubble on the chart.
Public Sub LoadChart(ByVal impact As Integer, _ ByVal likelihood As Integer) Try ' Optionally you could set a color fill: 'chtHeatMap.Appearance.FillStyle.MainColor = System.Drawing.ColorTranslator.FromHtml("#DADEE6") ' Optionally you could set a skin: 'chtHeatMap.Skin = "WebBlue" chtHeatMap.Appearance.Border.Visible = True chtHeatMap.Appearance.Border.Width = 2 chtHeatMap.Appearance.FillStyle.FillType = Styles.FillType.Image chtHeatMap.Appearance.FillStyle.FillSettings.BackgroundImage = "~\HeatMap\heatmap2.png" chtHeatMap.Chart.ChartTitle.TextBlock.Text = "Residual Risk Heat Map" chtHeatMap.Chart.ChartTitle.Appearance.FillStyle.MainColor = System.Drawing.ColorTranslator.FromHtml("#DADEE6") chtHeatMap.PlotArea.XAxis.LayoutMode = Styles.ChartAxisLayoutMode.Normal chtHeatMap.PlotArea.XAxis.AutoScale = False chtHeatMap.PlotArea.XAxis.MinValue = 0 chtHeatMap.PlotArea.XAxis.MaxValue = 3 chtHeatMap.PlotArea.XAxis.Step = 1 chtHeatMap.PlotArea.XAxis.Appearance.MajorTick.Visible = False chtHeatMap.PlotArea.XAxis.Appearance.LabelAppearance.Visible = False chtHeatMap.PlotArea.YAxis.AutoScale = False chtHeatMap.PlotArea.YAxis.MinValue = 0 chtHeatMap.PlotArea.YAxis.MaxValue = 3 chtHeatMap.PlotArea.YAxis.Step = 1 chtHeatMap.PlotArea.YAxis.Appearance.MajorTick.Visible = False chtHeatMap.PlotArea.YAxis.Appearance.MinorTick.Visible = False chtHeatMap.PlotArea.YAxis.Appearance.LabelAppearance.Visible = False Dim seriesLow As New Telerik.Charting.ChartSeries chtHeatMap.AddChartSeries(seriesLow) seriesLow.Type = ChartSeriesType.Gantt seriesLow.Appearance.LabelAppearance.Visible = False Dim seriesMedium As New Telerik.Charting.ChartSeries chtHeatMap.AddChartSeries(seriesMedium) seriesMedium.Type = ChartSeriesType.Gantt seriesMedium.Appearance.LabelAppearance.Visible = False Dim seriesHigh As New Telerik.Charting.ChartSeries chtHeatMap.AddChartSeries(seriesHigh) seriesHigh.Type = ChartSeriesType.Gantt seriesHigh.Appearance.LabelAppearance.Visible = False seriesLow.Name = "Low" seriesMedium.Name = "Medium" seriesHigh.Name = "High" seriesLow.Appearance.FillStyle.MainColor = System.Drawing.ColorTranslator.FromHtml("#B3FFB3") seriesMedium.Appearance.FillStyle.MainColor = System.Drawing.ColorTranslator.FromHtml("#FFFFB3") seriesHigh.Appearance.FillStyle.MainColor = System.Drawing.ColorTranslator.FromHtml("#FFA6A6") seriesLow.Appearance.FillStyle.SecondColor = Drawing.Color.Green seriesMedium.Appearance.FillStyle.SecondColor = Drawing.Color.Yellow seriesHigh.Appearance.FillStyle.SecondColor = Drawing.Color.Red 'seriesLow.Appearance.FillStyle.FillType = Styles.FillType.Solid 'seriesMedium.Appearance.FillStyle.FillType = Styles.FillType.Solid 'seriesHigh.Appearance.FillStyle.FillType = Styles.FillType.Solid Dim seriesBubble As New Telerik.Charting.ChartSeries chtHeatMap.AddChartSeries(seriesBubble) seriesBubble.Type = ChartSeriesType.Bubble seriesBubble.Appearance.LegendDisplayMode = ChartSeriesLegendDisplayMode.Nothing seriesBubble.Appearance.BubbleSize = 50 seriesBubble.Appearance.PointDimentions.AutoSize = False seriesBubble.Appearance.PointDimentions.Height = 30 seriesBubble.Appearance.PointDimentions.Width = 30 seriesBubble.Appearance.FillStyle.FillType = Styles.FillType.Gradient seriesBubble.Appearance.FillStyle.MainColor = System.Drawing.ColorTranslator.FromHtml("#219CEF") seriesBubble.Appearance.FillStyle.SecondColor = System.Drawing.ColorTranslator.FromHtml("#01467D") seriesBubble.Appearance.LabelAppearance.Visible = False seriesBubble.Appearance.Border.Visible = False Dim lowItem1 As New Telerik.Charting.ChartSeriesItem seriesLow.AddItem(lowItem1) lowItem1.XValue = 0 lowItem1.XValue2 = 1 lowItem1.YValue = 1 lowItem1.YValue2 = 0 Dim lowItem2 As New Telerik.Charting.ChartSeriesItem seriesLow.AddItem(lowItem2) lowItem2.XValue = 0 lowItem2.XValue2 = 1 lowItem2.YValue = 2 lowItem2.YValue2 = 1 Dim lowItem3 As New Telerik.Charting.ChartSeriesItem seriesLow.AddItem(lowItem3) lowItem3.XValue = 1 lowItem3.XValue2 = 2 lowItem3.YValue = 2 lowItem3.YValue2 = 0 Dim mediumItem1 As New Telerik.Charting.ChartSeriesItem seriesMedium.AddItem(mediumItem1) mediumItem1.XValue = 0 mediumItem1.XValue2 = 1 mediumItem1.YValue = 3 mediumItem1.YValue2 = 2 Dim mediumItem2 As New Telerik.Charting.ChartSeriesItem seriesMedium.AddItem(mediumItem2) mediumItem2.XValue = 1 mediumItem2.XValue2 = 2 mediumItem2.YValue = 2 mediumItem2.YValue2 = 1 Dim mediumItem3 As New Telerik.Charting.ChartSeriesItem seriesMedium.AddItem(mediumItem3) mediumItem3.XValue = 2 mediumItem3.XValue2 = 3 mediumItem3.YValue = 3 mediumItem3.YValue2 = 0 Dim highItem1 As New Telerik.Charting.ChartSeriesItem seriesHigh.AddItem(highItem1) highItem1.XValue = 1 highItem1.XValue2 = 2 highItem1.YValue = 3 highItem1.YValue2 = 2 Dim highItem2 As New Telerik.Charting.ChartSeriesItem seriesHigh.AddItem(highItem2) highItem2.XValue = 2 highItem2.XValue2 = 3 highItem2.YValue = 3 highItem2.YValue2 = 2 Dim highItem3 As New Telerik.Charting.ChartSeriesItem seriesHigh.AddItem(highItem3) highItem3.XValue = 2 highItem3.XValue2 = 3 highItem3.YValue = 2 highItem3.YValue2 = 1 SetRating(impact, likelihood, seriesBubble) Catch ex As Exception SendError(ex.Message) End Try End Sub
The SetRating function passes in the impact and likelihood and sets the Bubble to the corresponding location in the Heatmap.
Protected Sub SetRating(ByVal impact As Integer, _ ByVal likelihood As Integer, _ ByVal seriesBubble As Telerik.Charting.ChartSeries) Try Dim bubbleItem As New Telerik.Charting.ChartSeriesItem seriesBubble.AddItem(bubbleItem) Dim xV As Integer = 0 xV = impact - 1 ' zero based bubbleItem.XValue = xV + 0.5 Dim yV As Integer = 0 yV = likelihood - 1 ' zero based bubbleItem.YValue = yV + 0.5 Catch ex As Exception SendError(ex.Message) End Try End Sub
Our SendError function simply populates the error label:
Protected Sub SendError(ByVal errorMessage As String) If errorMessage <> String.Empty Then lblError.Text = errorMessage End If End SubThanks to Ves, Telerik's support team, for providing a 2x2 code-in-front example. I have setup this project entirely in code-behind and added more features.
[SIGNATURE]